This Bitcoin price model targets a ‘conservative’ $255K by year-end

Bitcoin (BTC) is down roughly 40% from its October 2025 record high, but a long-term valuation model suggests the cryptocurrency could erase the entire decline and rally to as high as $255,000 by year-end.
Key takeaways:
- Bitcoin Decay Channel puts BTC’s conservative year-end range at $90,000–$255,000, with its 2027 range extending to $128,000–$308,000.
- Bearish HODL Waves suggest a possible higher bottom in the $65,900–$70,500 range.
Bitcoin model puts BTC's year-end target in the $90,000–$255,000 range
The Bitcoin Decay Channel is a logarithmic price model that tracks BTC’s long-term uptrend while adjusting for smaller gains in each new cycle.
The cryptocurrency's major tops in 2013, 2017 and 2021 formed near the model's upper valuation bands, while bear-market lows repeatedly moved back toward its lower support zone.
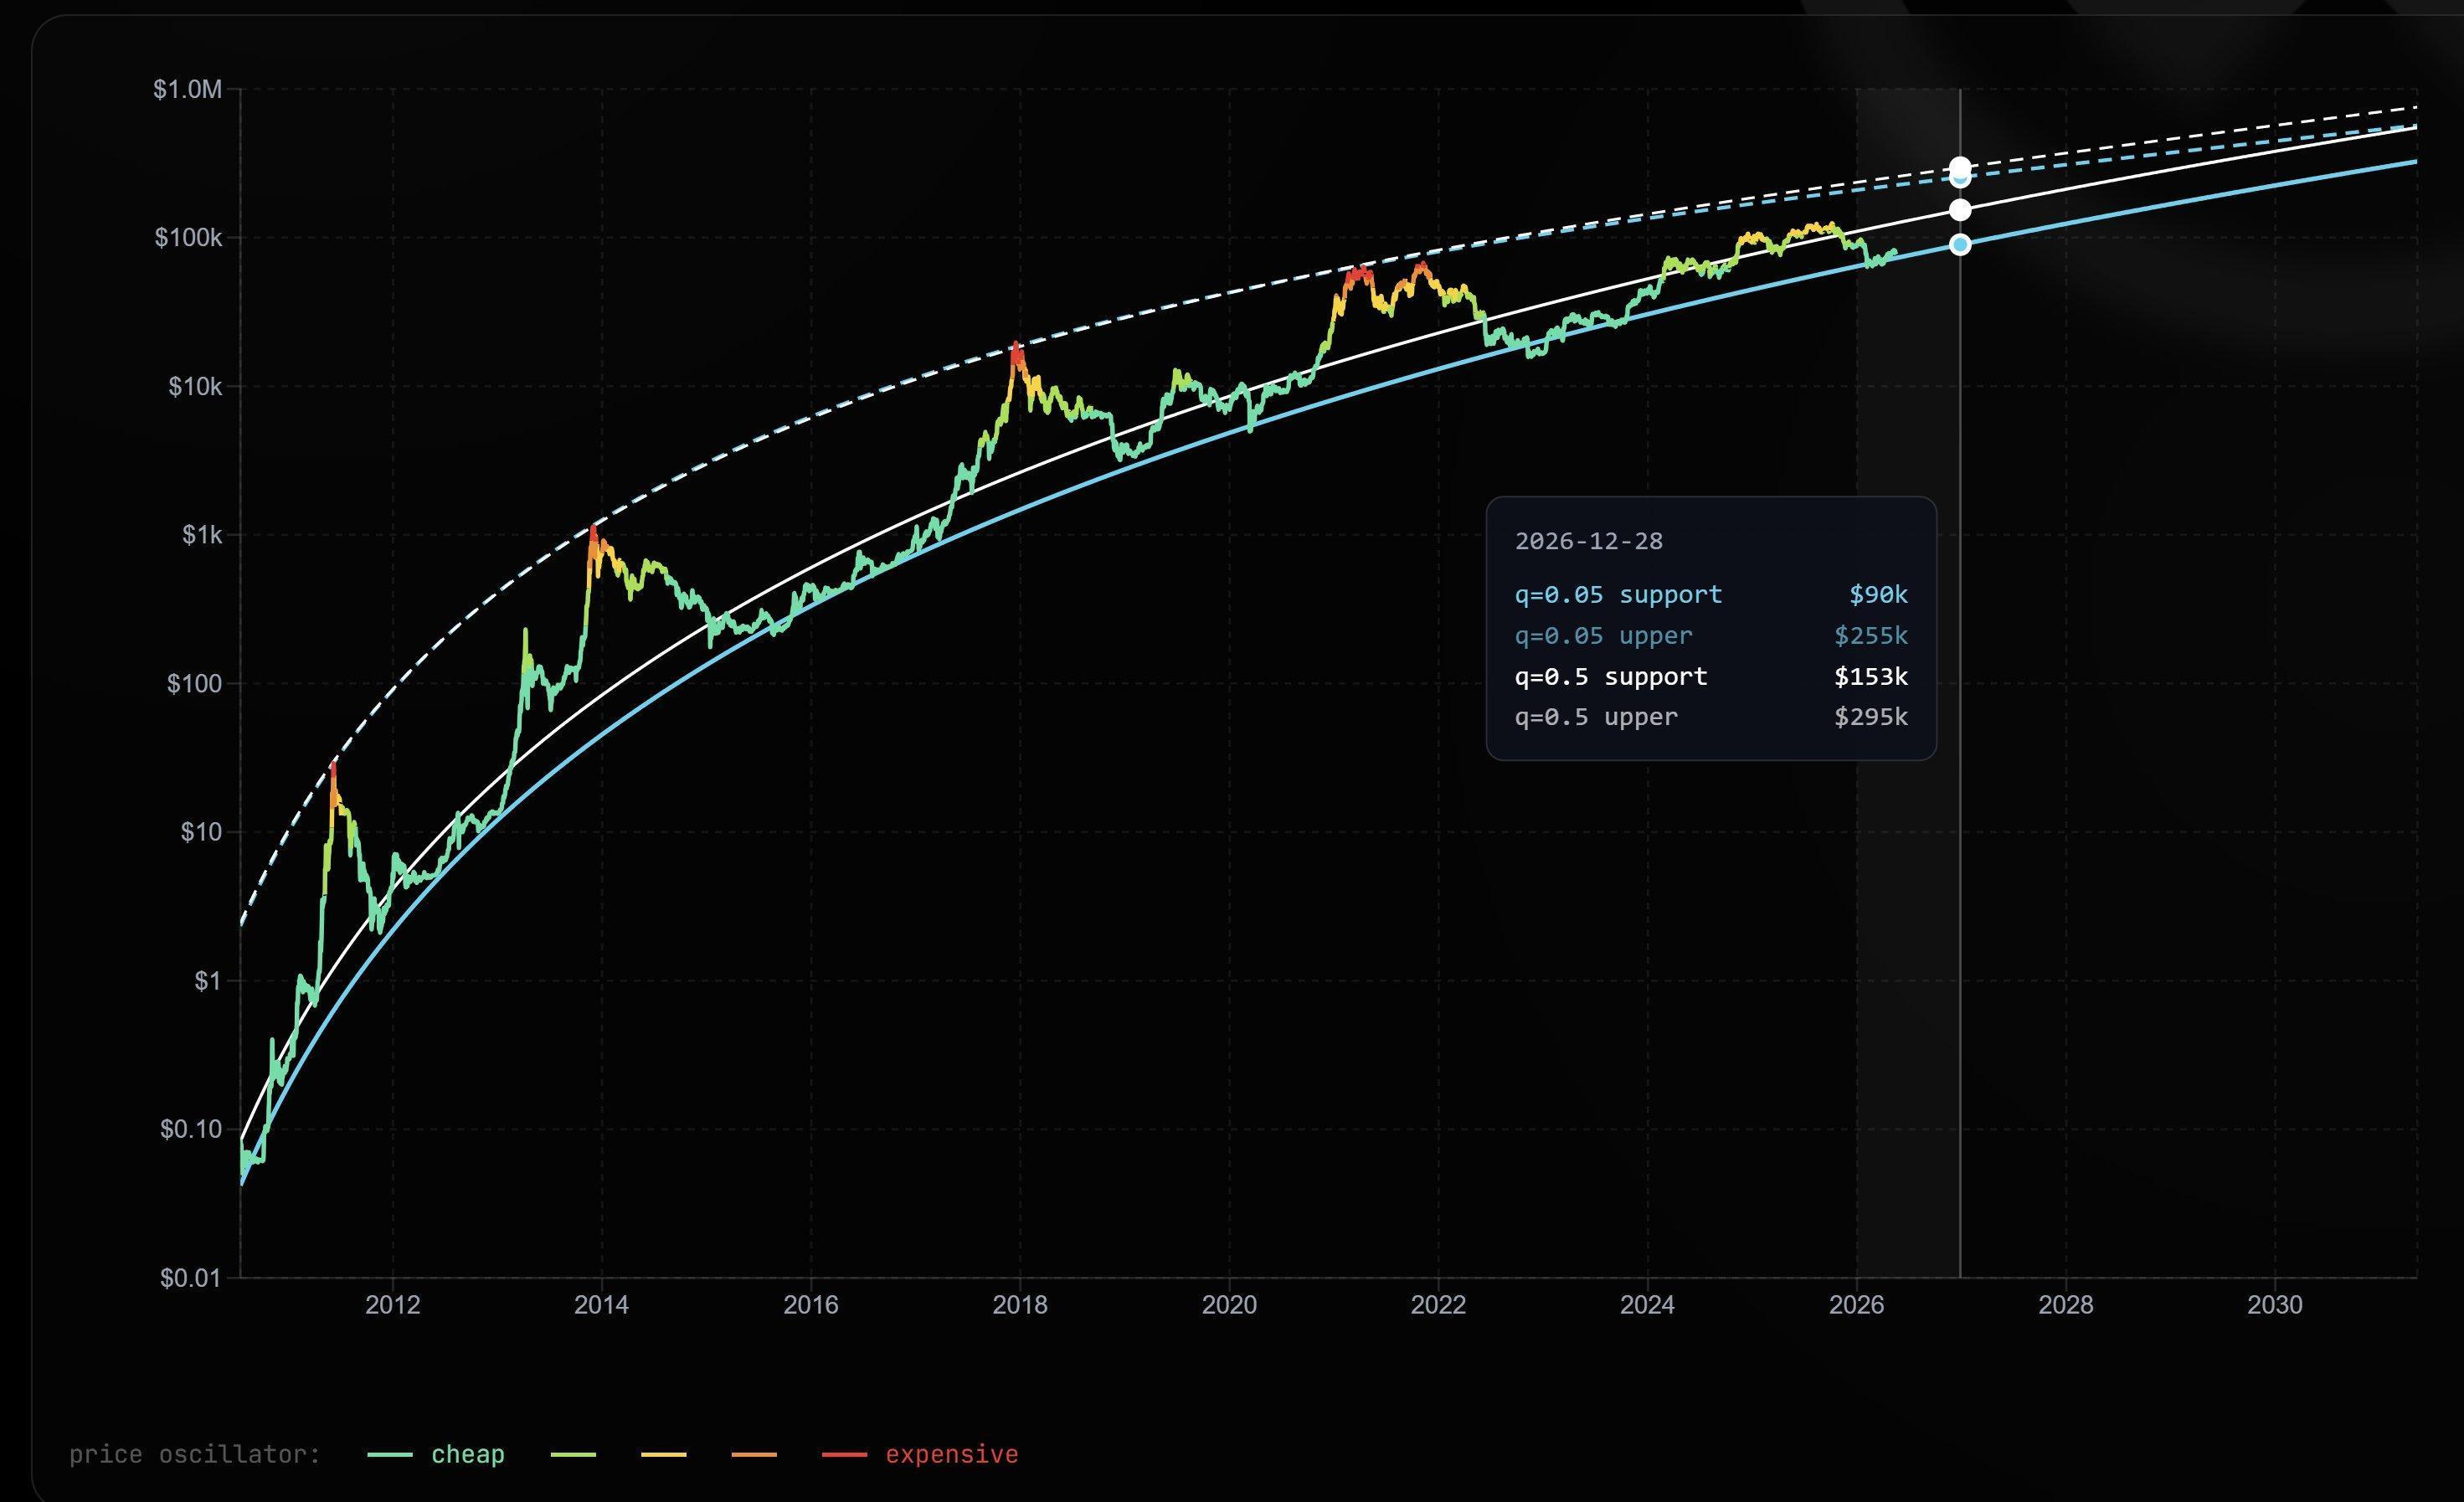
BTC/USD price performance to date. Source: Sminston/TradingView
Bitcoin’s latest rebound also began near the lower end of the Decay Channel in March-April, showing that buyers stepped in around a zone the model has historically treated as long-term support, or bottom.
That keeps the bullish case alive, according to analyst Sminston.
"Bitcoin Decay Channel gives a pretty reasonable range—conservative case—of $90k–$255k, by the end of this year. $128k - $308k for end of '27," he said in a Wednesday post, adding:
"For comparison, Bitcoin was $43k in December 2023."
Sminston’s $90,000–$255,000 Bitcoin target range fits multiple predictions calling for BTC to reach a new all-time high in 2026.
Earlier, Bernstein analysts maintained a $150,000 Bitcoin target for 2026, while pushing their $200,000 peak forecast into 2027, citing a longer institutional adoption cycle led by BTC ETFs and public companies.
BitMEX co-founder Arthur Hayes expected Bitcoin to reclaim $126,000 this year, citing US war spending in Iran, AI infrastructure demand and the resulting pressure for more fiat liquidity.
Bear flag and other indicators hint at persistent BTC sell-off risks
Bitcoin continues facing selloff warnings from a slew of bearish indicators, including a multi-month bear flag.
A bear flag typically resolves when the price drops by as much as the previous downtrend's height. BTC risks plunging under $56,000, down about 30% from current prices, if the classic breakdown setup plays out as intended.
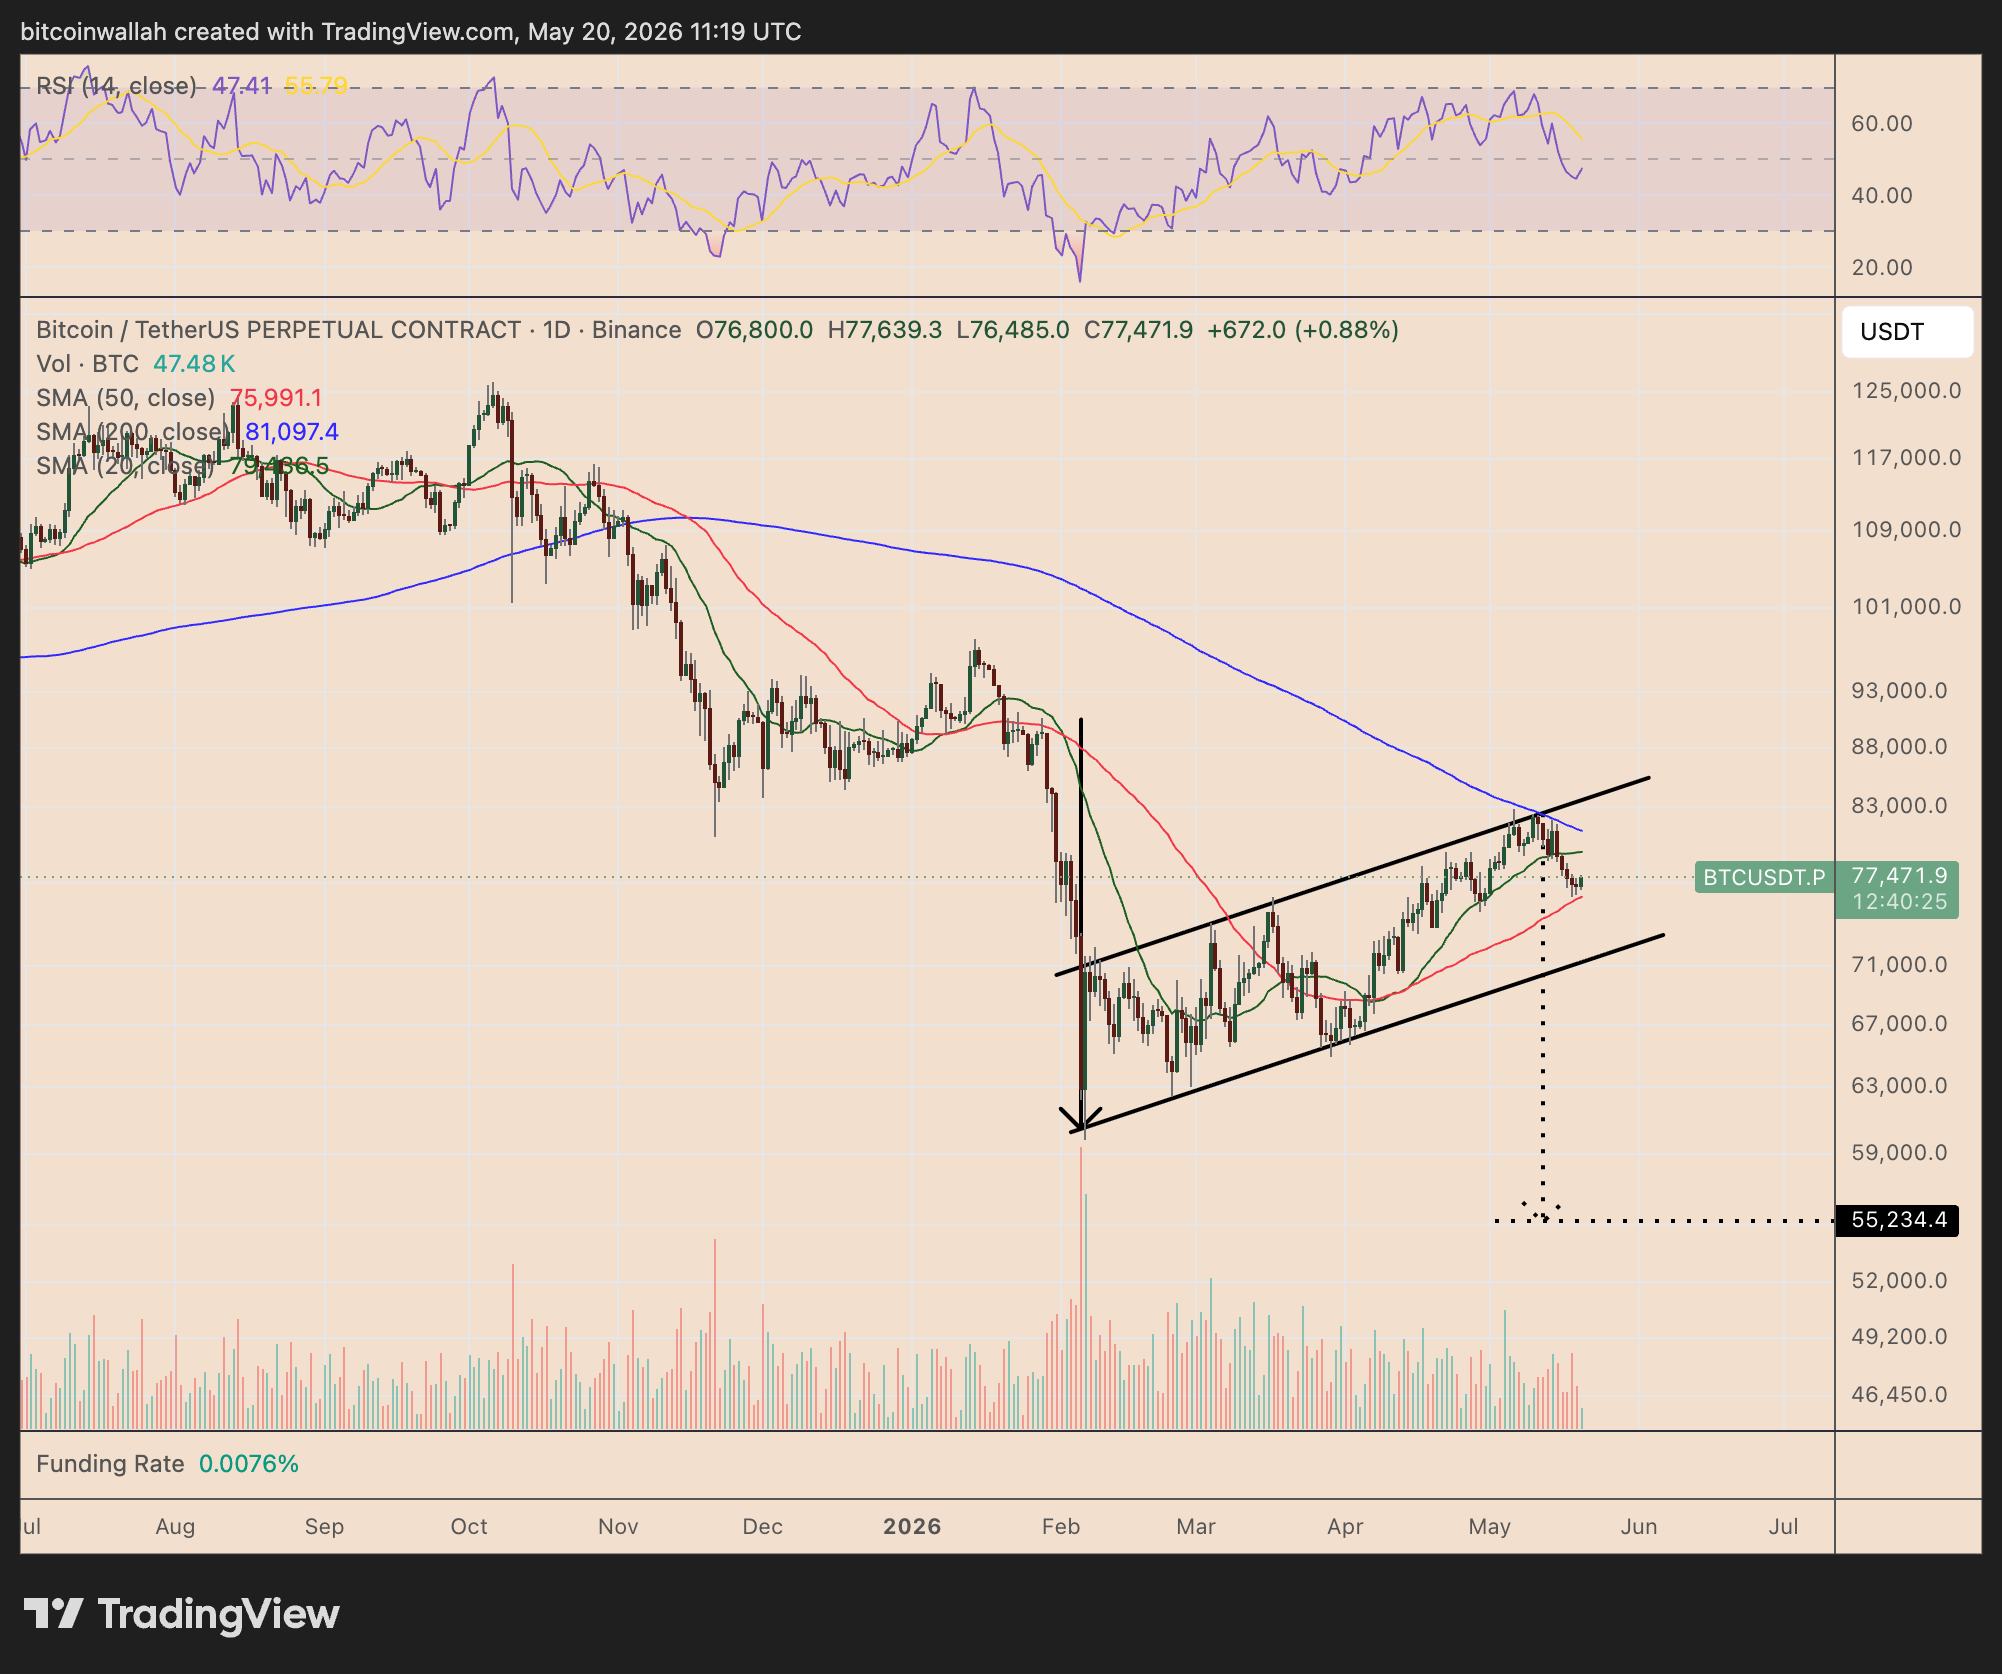
BTC/USDT daily chart. Source: TradingView
On-chain data suggests Bitcoin may not need to fall as far as the bear-flag target.
The Bitcoin HODL Waves indicator, which tracks how long BTC remains unmoved in wallets, suggests a possible bottom in the $65,900–$70,500 range if the weakness continues.
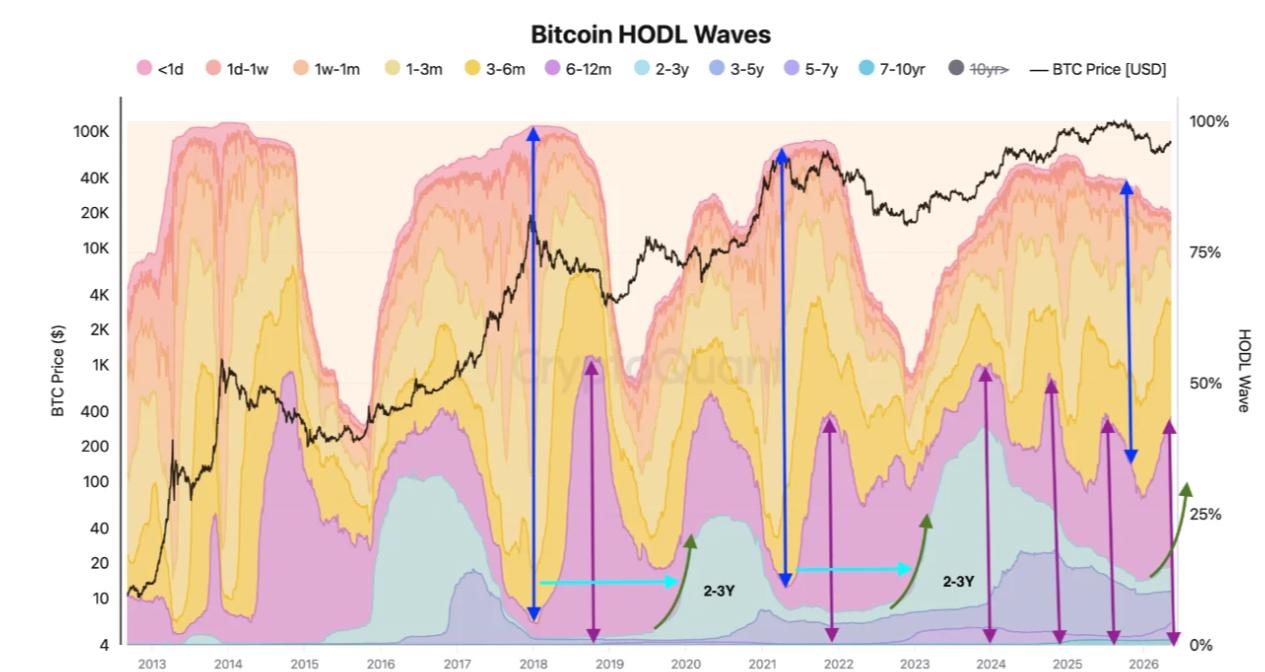
Bitcoin HODL wave indicator. Source: CryptoQuant
In a Tuesday post, CryptoQuant analyst Sunny Mom said a stronger long-term holder base may help BTC form a higher, slower bottom this cycle, with $70,500 as the key level to hold.
Disclaimer: The content of this article solely reflects the author's opinion and does not represent the platform in any capacity. This article is not intended to serve as a reference for making investment decisions.
You may also like
Indonesia’s radical export experiment upends its commodity trade

Gold Price Risks 6% Drop as Smart Money Quietly Sells the Top
Bitwise CIO Says Hyperliquid Is a Financial “Super App” Amid $2.6B RWA Open Interest
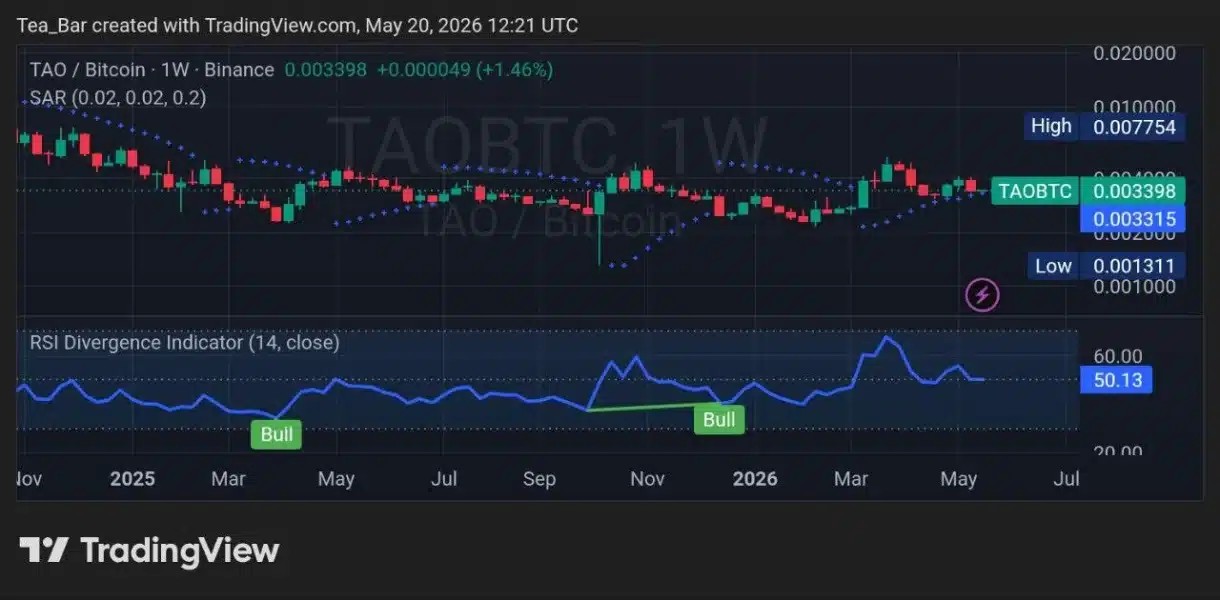
Bittensor’s Newest Subnet Could Change AI Crypto’s Future