
The Real Battlefield Under the Fog in Iran: 4.34% Yield Ambushes Gold Price, 4683 Defense Line About to Face the Enemy

Huitong Net, April 23— With geopolitical tensions persisting and structural risks on the crude oil supply side, the commodities and currency markets are at a critical pricing window. Currently, market sentiment is swinging between concerns over recession and persistent inflation. In the short term, the rebound in yields is redefining cross-asset liquidity allocation, with overall volatility remaining high.
On Thursday (April 23), global financial markets presented heightened volatility within a complex macro environment. With ongoing geopolitical stalemates and structural risks on the oil supply side, commodities and currency markets are within a crucial pricing window. Against the backdrop of a “non-war, non-peace,” concerns about the safety of passage through the Strait of Hormuz have pushed Brent crude back above the $100 (UTC+8) mark. This spike in energy prices feeds directly into inflation expectations, driving US Treasury yields higher, and in turn exerting significant pricing pressure on non-yielding assets such as spot gold. At present, market sentiment sways between recession fears and sticky inflation. In the short term, the dollar’s strong position, supported by rising yields, is redefining cross-asset liquidity allocation, and overall volatility remains elevated.
Crude Oil: The Game of Geopolitical Premium and Contraction Risk
According to the latest industry information, policy guidance related to tariff statements and current blockages of Middle East shipping routes have rendered the crude oil market extremely sensitive. On the technical front, crude oil's near-month contracts show a clear pattern of strength. Although recent profit-taking around $97.22 (UTC+8) due to the emergence of a “double top” led to a pullback below $94 (UTC+8), the overall upward trendline remains intact.
On the fundamental logic side, prolonged blockages of key routes have directly increased energy costs. Renowned institutions point out that this strategic deadlock not only supports oil prices but also raises the risk of a global economic contraction. If high oil prices persist, global growth in 2026 might drop to 2%, further intensifying market risk aversion. However, this risk aversion has not flowed into gold, instead reflecting in the bond market due to inflation concerns. Technically, crude oil is currently facing near-term resistance at
Spot Gold: Technical Correction under High Yield Environment
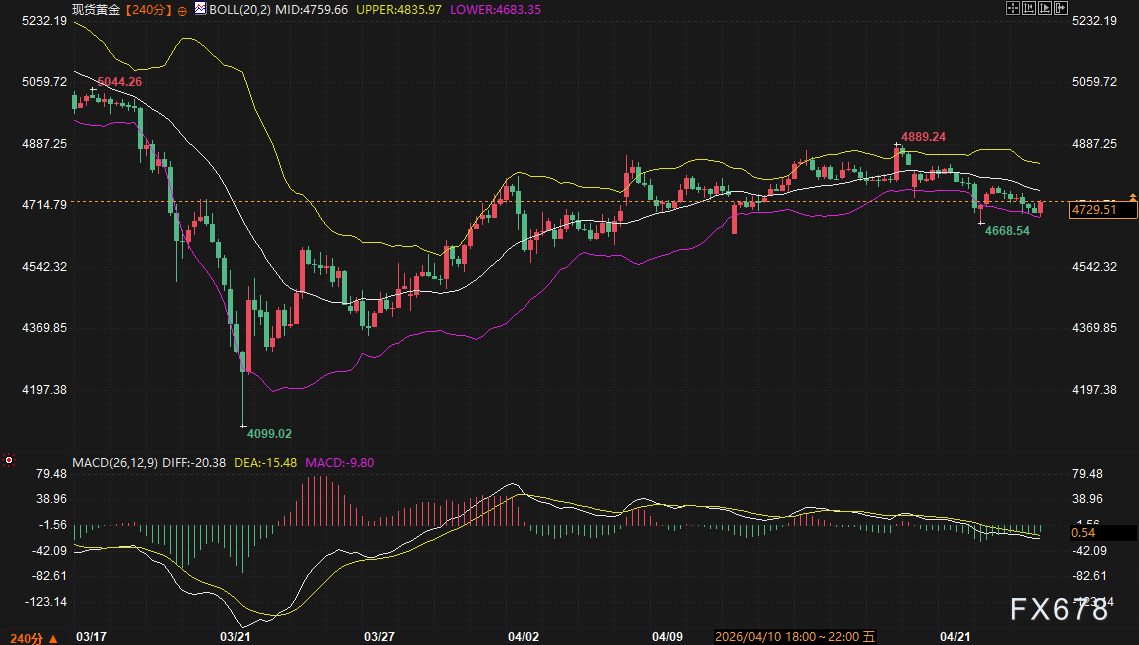
On the 240-minute (UTC+8) chart, spot gold shows a clear corrective trajectory. Currently quoted around 4729.51 (UTC+8), it is trading in the weak region between the midline (4759.66) and lower band (4683.35) of the Bollinger Bands. The MACD indicator shows both DIFF and DEA lines below the zero axis, with continued green bars, indicating short-term dominance of bearish momentum. Although narrowing bars suggest some easing of downward momentum, there is a lack of sufficient bullish reversal signals.
Gold prices are being squeezed by both “rising inflation” and “persistently high interest rates.” Although gold carries safe-haven attributes, with the 10-year US Treasury yield climbing near 4.340% (UTC+8) and opportunity costs increasing significantly, investors are more inclined to hold dollars or high-yielding assets. Technical analysis indicates that gold faces heavy resistance in the
US Treasury Yields: Strong Pattern Squeezing Market Space
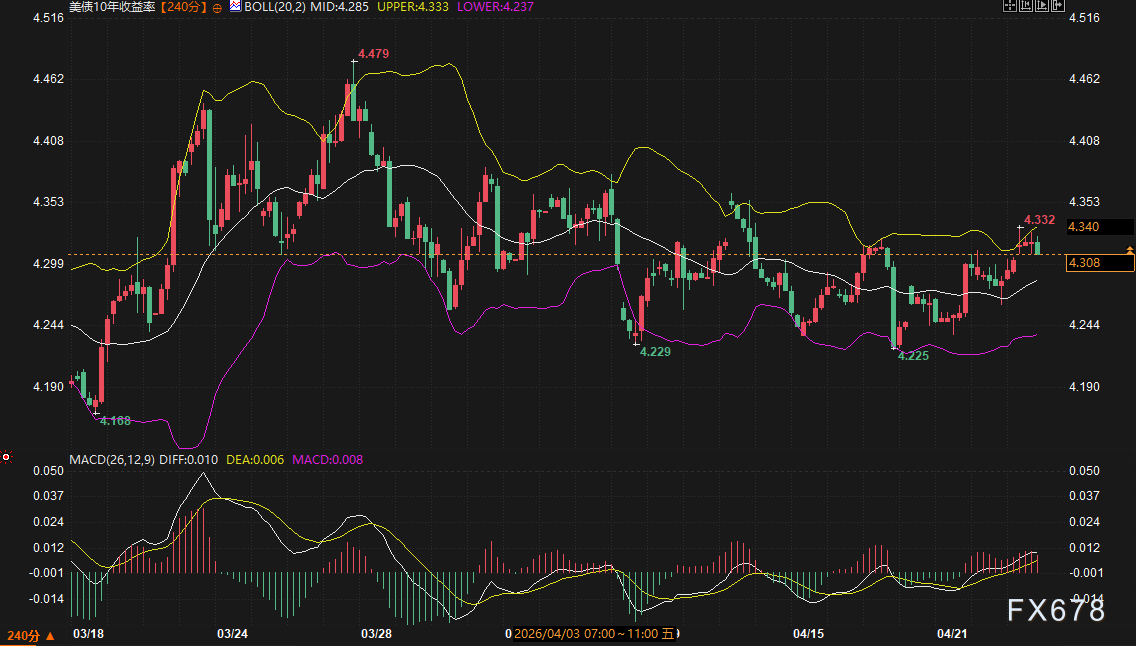
The 10-year US Treasury yield has shown strong upward momentum recently, with the latest dynamic quote touching 4.340% (UTC+8). In the 240-minute (UTC+8) period, a MACD golden cross has appeared, and yields are trading between the middle (4.285) and upper (4.333) bands of the Bollinger Bands, demonstrating a clear bullish pattern. Well-known institutional surveys show that the inflation rebound driven by energy shocks may delay the Federal Reserve’s window for rate cuts by six months, and this changing expectation directly supports the dollar’s exchange rate performance.
From the chart, yields are facing interim resistance in the
Outlook
Taking both fundamental and technical factors into account, over the next 2-3 (UTC+8) trading days the market is expected to exhibit the pattern of “energy prices maintaining premiums; US Treasury yields consolidating at high levels; gold building a base at lower levels.” Crude oil, due to geopolitical uncertainty, will continue to lead inflation expectations, with volatility in the $87 (UTC+8) to $98 (UTC+8) range directly setting the tone for bond market fluctuations. Spot gold lacks short-term upward momentum, with focus on the effectiveness of support at $4683 (UTC+8); if this fails, room for a further correction opens up. Supported by both safe-haven demand and yield advantage, the dollar’s near-term bullish logic is difficult to refute.
[Frequently Asked Questions]
Usually, geopolitical turmoil lifts gold prices, but the core logic this time is that surging energy prices have triggered strong inflation expectations. This expectation has forced US Treasury yields to rise significantly, convincing the market that rates will remain high for longer. For non-interest-bearing assets such as gold, the increased holding cost brought by high yields outweighs its safe-haven appeal, causing gold prices to fall passively in an environment where both the dollar and yields are rising.
According to renowned institutional forecasts, if oil prices remain above $100 (UTC+8) for an extended period due to route blockages, global GDP growth could fall from the baseline of 3.1% to 2.0%. This “stagflationary” risk would intensify contraction in manufacturing (such as reduced output in the European aviation industry) and lead to surging end-consumer costs. Against this backdrop, market concerns about an economic recession will gradually grow.
On the 240 (UTC+8)-minute chart, key support lies in the 4683 (UTC+8) - 4700 (UTC+8) range. If the closing price falls below the lower Bollinger Band at 4683 (UTC+8), support at 4668 (UTC+8) and even lower will be threatened. Rebound resistance is mainly around the middle Bollinger Band at 4759 (UTC+8) as well as the previous recovery high of 4889 (UTC+8). Until the MACD indicator returns above the zero axis, any rebound is likely to be seen as a technical correction rather than a trend reversal.
Yields rising above 4.34% (UTC+8) indicate capital is returning to low-risk, fixed-income assets. This not only suppresses the performance of commodities (gold, silver), but also, through a higher discount rate, puts pressure on global equity market valuations. Investors should pay attention to Thursday’s PMI and employment data; if these data are stronger than expected, yields could break further towards the 4.47% (UTC+8) zone.
This creates a highly uncertain policy backdrop. Tariff rhetoric tends to boost the dollar’s safe haven buying, while energy-driven inflation keeps the Fed in a hawkish stance. Given this dual logic, dollar strength against non-US currencies is expected to persist. So long as the situation in the Strait of Hormuz remains unresolved, this supply-side-driven dollar strength retains strong intrinsic momentum.
Disclaimer: The content of this article solely reflects the author's opinion and does not represent the platform in any capacity. This article is not intended to serve as a reference for making investment decisions.
You may also like
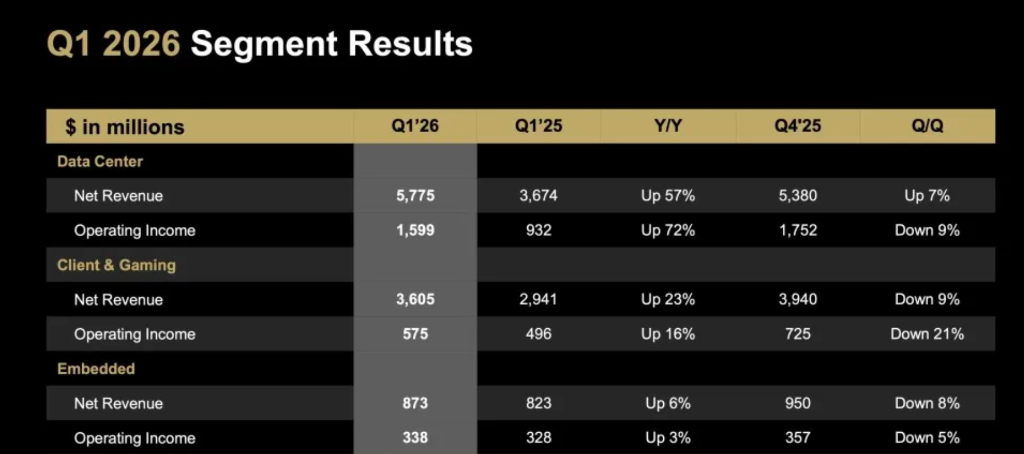
AMD, the new data center king with a $700 billion market cap

United Kingdom: Sluggish jobs outlook persists – Deutsche Bank
PROM fluctuates 57.5% in 24 hours: Surge in trading volume and futures positions drive movement