Bitget App
Trade smarter
Buy cryptoMarketsTradeFuturesEarnSquareMore
PEPE Holds Tight Range Near $0.054 as Support and Resistance Limit Price Movement

PEPE Holds Tight Range Near $0.054 as Support and Resistance Limit Price Movement

CryptonewslandCryptonewsland2025/12/14 20:12
By:by Vee Peninah
  • PEPE is trading between a tight range of $0.054322 and $0.054422 with high intraday containment at the support and resistance levels.
  • The short term momentum indicators are not strong as they are an indication of the presence of both buying and selling pressure as opposed to direction.
  • Although the USD fell by 1.4 percent, PEPE shows slight positive returns relative to Bitcoin and Ethereum, which means that the pair performs erratically.

Pepe was trading in a narrow band today as the short term momentum was limited due to strong resistance. According to Binance data, PEPE/USDT was trading at a rate of $0.054343, which represents a one point four percent drop in the last 24 hours. Trading activity remained contained and trade was focused between well delineated intraday levels. It is important to note that the technical indicators in the 1-hour chart indicated further consolidation and not directional growth.

Price Holds Near Support Amid Narrow Trading Band

PEPE maintained proximity to its stated support level at $0.054322 throughout the session. This level remained intact despite repeated tests, which limited further downside movement. However, price advances also met immediate selling pressure near $0.054422. This resistance capped upward attempts and reinforced the narrow 24-hour range.

As a result, the token oscillated within a band of just $0.000100. This restricted movement highlighted reduced volatility during the observed period. Moreover, the steady defense of support suggested balanced order flow rather than aggressive positioning. The market therefore showed stability without directional conviction. This tight range framed the broader technical environment. It also set the stage for indicator-based observations that followed on lower timeframes.

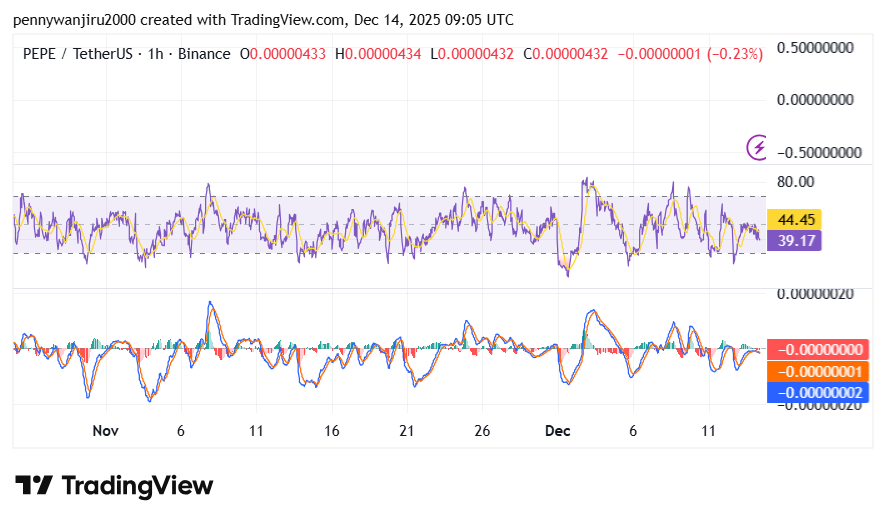
Technical Indicators Signal Neutral-to-Bearish Momentum Within a Sideways Range

On the one-hour chart, relative strength metrics remained below the neutral midpoint. RSI readings hovered near the low-40s, confirming limited buying strength. However, the indicator avoided oversold territory, which aligned with the observed support holding behavior.

PEPE Holds Tight Range Near $0.054 as Support and Resistance Limit Price Movement image 0 PEPE Holds Tight Range Near $0.054 as Support and Resistance Limit Price Movement image 1 Source: TradingView

At the same time, momentum oscillators tracked close to their baselines. These readings reflected equilibrium between buyers and sellers. Notably, no sharp divergences appeared during the session. This absence reinforced the sideways structure already evident in price data. 

The MACD line was trading slightly below the signal line showing bearish momentum. Without a break above resistance or below support, momentum remained constrained. Consequently, traders focused on these fixed levels rather than trend continuation.

Cross-Pair Performance and Short-Term Outlook

Beyond dollar pricing, PEPE showed relative strength against major assets. The token gained 1.2% against Bitcoin, trading at 0.0104819 BTC. Additionally, it rose 1.5% versus Ethereum to 0.081395 ETH. These moves occurred despite the dollar-based decline.

This divergence highlighted mixed short-term conditions across trading pairs. While USD performance weakened, cross-pair metrics improved modestly. Such behavior reflected shifting capital allocation rather than broad market pressure.

Looking ahead, the existing structure emphasized level-based trading. Continued interaction between $0.054322 support and $0.054422 resistance defined near-term conditions. Any change in this balance would require movement beyond the current range. Until then, price action remained shaped by containment rather than expansion.

0
0

Disclaimer: The content of this article solely reflects the author's opinion and does not represent the platform in any capacity. This article is not intended to serve as a reference for making investment decisions.

PoolX: Earn new token airdrops
Lock your assets and earn 10%+ APR
Lock now!

You may also like

Solana's Latest Price Fluctuations: On-Chain System Vulnerabilities and Investor Sentiment in Advanced Blockchain Networks

- Solana's 2025 market volatility stems from technical vulnerabilities, validator instability, and shifting investor sentiment, with SOL experiencing a 150% drawdown from its peak. - Validator count dropped 68% since 2023, raising decentralization concerns as institutional participants adopt MPC solutions to mitigate downtime risks. - Institutional adoption grew via ETFs like SOEZ and BSOL , yet infrastructure risks prompted cautious on-chain behavior and diversified risk management strategies. - DeFi TVL

Bitget-RWA2025/12/15 16:58
Solana's Latest Price Fluctuations: On-Chain System Vulnerabilities and Investor Sentiment in Advanced Blockchain Networks

Bitcoin Leverage Wipeout: Systemic Threats in Cryptocurrency Derivatives Markets

- 2025 Bitcoin leverage liquidation events ($19B+ in October, $543M in December) exposed systemic risks in crypto derivatives markets, with Bitcoin short positions disproportionately affected. - Crisis revealed interconnectedness between crypto and traditional finance, as stablecoin de-pegging and liquidity shocks impacted U.S. Treasury markets and midcap tokens. - Regulators intensified oversight: FSB identified stablecoin/CASP gaps, Basel Committee adjusted prudential rules, and 70%+ jurisdictions advanc

Bitget-RWA2025/12/15 16:40
Bitcoin Leverage Wipeout: Systemic Threats in Cryptocurrency Derivatives Markets

Clean Energy Market Fluidity: How REsurety's CleanTrade Platform is Transforming Institutional Participation and Risk Strategies in Renewable Energy Trading

- REsurety's CleanTrade platform standardizes green energy trading, boosting institutional liquidity and risk management. - Launched in 2025, it facilitated $16B in trades, enabling transparent VPPA/PPA/REC trading and ESG-aligned hedging. - CFTC oversight reduces counterparty risk, aligning with decarbonization goals amid policy uncertainties. - Despite challenges like rising rates, CleanTrade bridges gaps by standardizing pricing and aggregating demand.

Bitget-RWA2025/12/15 16:40
Clean Energy Market Fluidity: How REsurety's CleanTrade Platform is Transforming Institutional Participation and Risk Strategies in Renewable Energy Trading

The Emergence of Clean Energy Derivatives: How CleanTrade is Transforming Institutional Investment in Renewable Resources

- CleanTrade's CFTC-approved SEF designation in 2025 revolutionizes clean energy derivatives by introducing institutional-grade liquidity and standardized trading for VPPAs, PPAs, and RECs. - The platform's $16B notional trading volume within two months demonstrates rapid institutional adoption, with major players like Cargill leveraging its transparent infrastructure to manage energy risks. - Integrated ESG analytics and automated compliance tools enable investors to align portfolios with sustainability g

Bitget-RWA2025/12/15 16:26
The Emergence of Clean Energy Derivatives: How CleanTrade is Transforming Institutional Investment in Renewable Resources
© 2025 Bitget