Crypto Market Prediction: $1,400,000,000 Bitcoin (BTC) Carnage Over, Ethereum (ETH) Crash Might Not Stop, Shiba Inu (SHIB) Market Collapse Ending

There is not much to hope for from a cryptocurrency when you see how troublesome the whole situation is: Bitcoin is slowing down after multibillion carnage among institutional and retail investors, Ethereum's crash is only gaining momentum and it seems like Shiba Inu is bottoming out.
Bitcoin running out of fuel
It appears that the $1.4 billion liquidation wave of Bitcoin has finally run out. The market printed the first real indication of seller fatigue following a straight-line decline that drove Bitcoin from the $110,000 area into the mid-$80,000s: a sharp recovery off oversold conditions combined with a noticeable slowdown in sell volume.
It usually takes a structural catalyst or a final capitulation flush to reset sentiment when the market gets this stretched. This instance was the latter. The damage is evident on the chart: Bitcoin easily cut through its 20-, 50- and 100-day moving averages. Every attempt at an intraday rally was thwarted by aggressive selling as momentum turned sharply bearish.
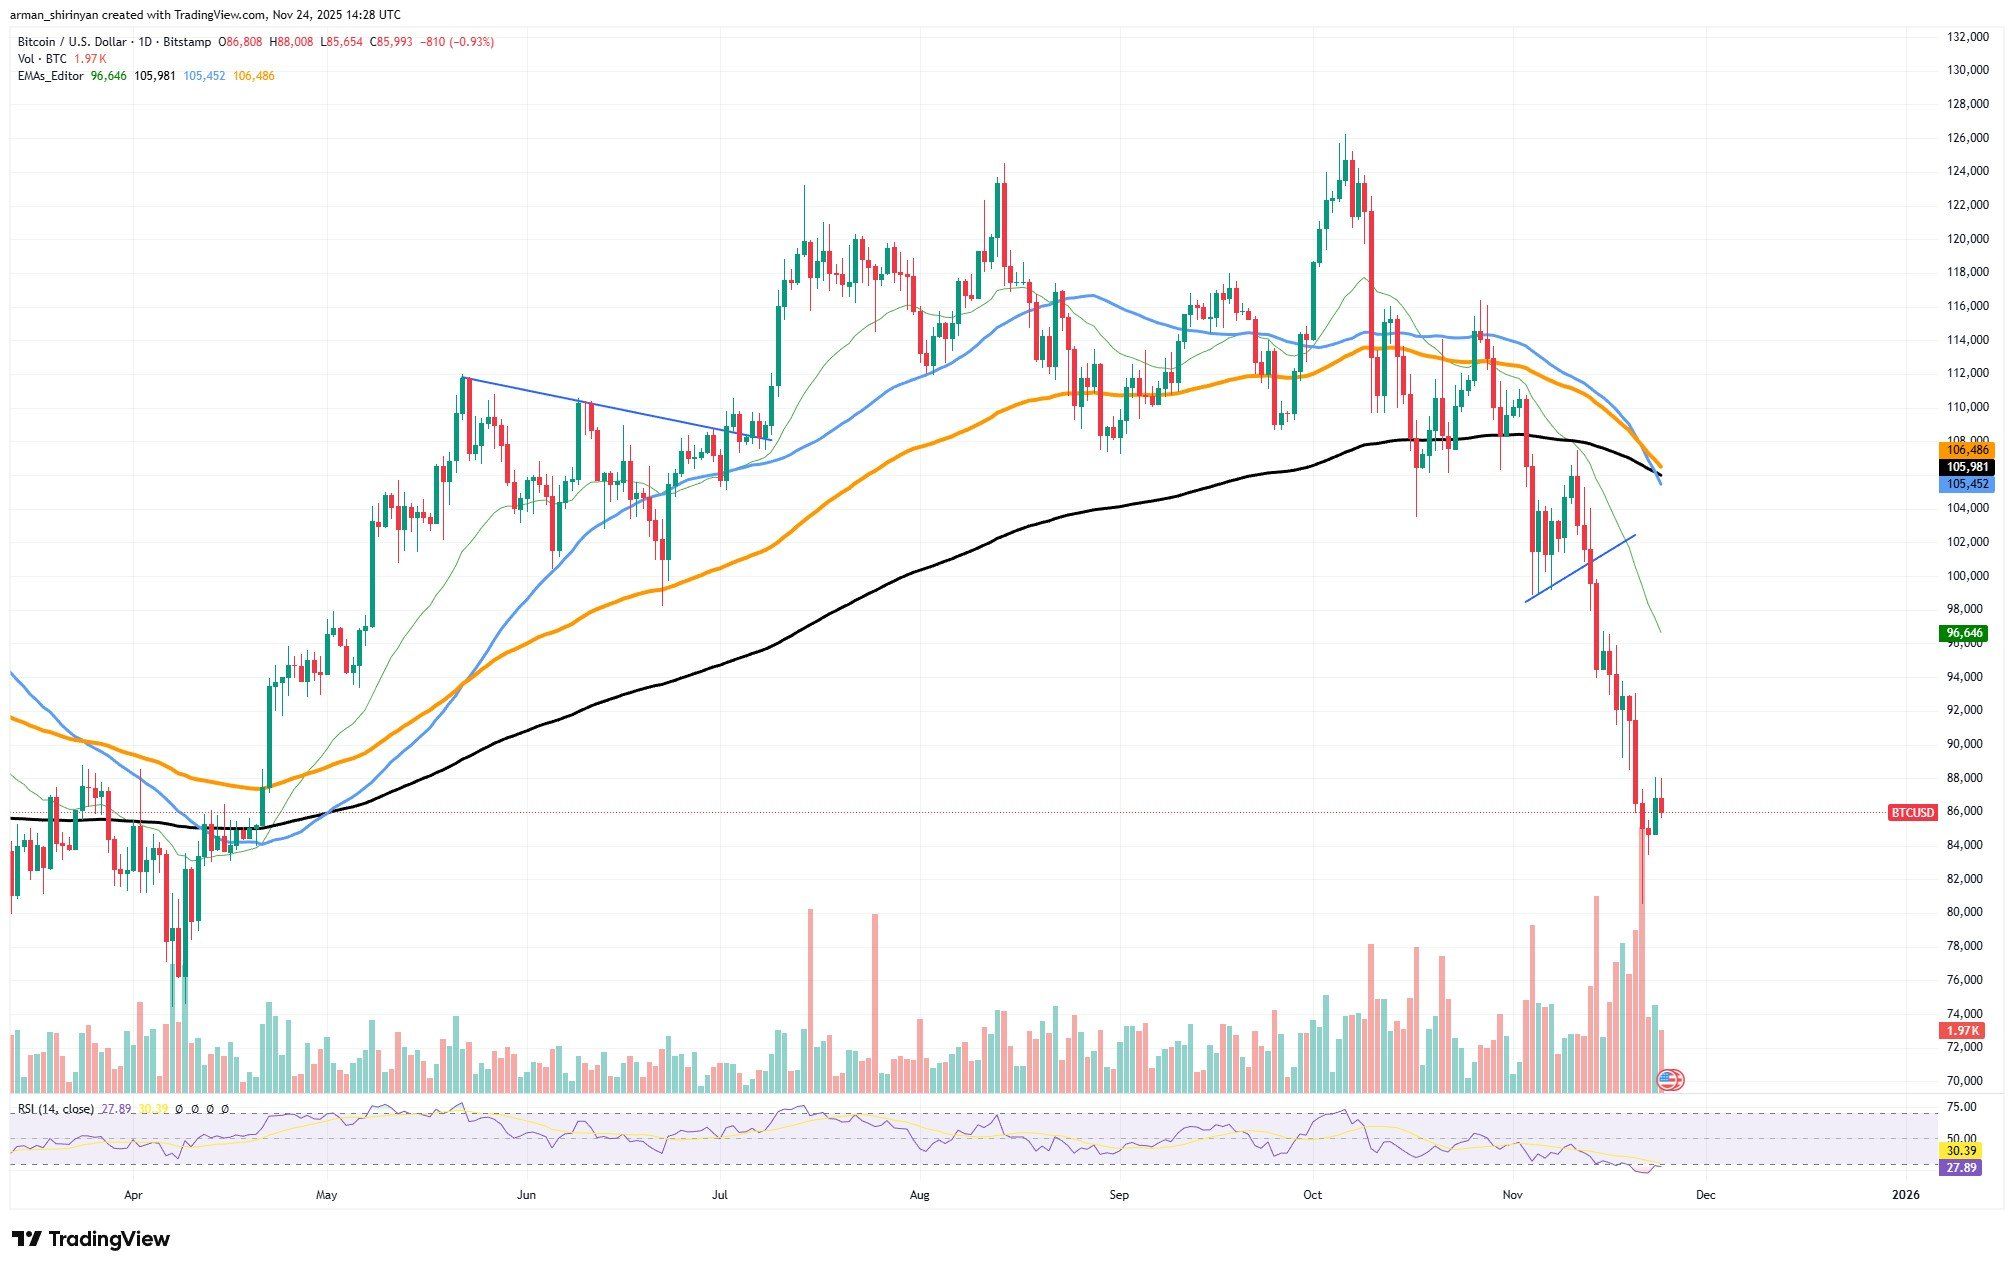
Additionally, buyers are intervening for the first time since the decline started, as seen by the long wicks near the bottom. The behavior of Bitcoin in this stabilization zone will determine what happens next. The worst of the chaos is probably over if Bitcoin can stay above the $83,000-$85,000 range. From this point on the price usually moves in the direction of retesting the broken moving averages, which are currently in the $96,000-$105,000 range.
First the 20-day and then the 50-day. This does not imply an instantaneous V-shaped reversal, but when sellers lose control, a grind higher is the normal course. A secondary retest of the lows poses the greatest risk. It becomes a classic bottom structure if the volume is lower and the floor is not broken.
BTC returns to the mid-$70,000s if it breaks. However, it appears that the market has finally released its selling pressure as of right now, and the $1.4 billion purge may have been the capitulation event required to reset the trend.
Ethereum in troublesome position
The one pattern that is beginning to emerge surrounding other significant assets is absent from Ethereum, and this is a problem. Following their capitulation flushes, Bitcoin and Shiba Inu both showed early indications of a rounding bottom, including strong selling, a rebound candle and a curved stabilization, as opposed to a straight rebound. This type of structure occurs when sellers run out of ammunition, and the price starts to bend rather than decline vertically.
However, that curve is absent from Ethereum. Its chart continues to show a steep, nearly linear downslope. Not even leveling. Not a curve. There is no proof that buyers are consciously consuming the supply. That is the initial red flag.
Without hesitation, ETH broke below all of the major moving averages, including the 20-, 50-, 100- and even 200-day, but it has not produced the kind of rebound candle you would anticipate from a true bottoming attempt. ETH did not react with a proper snap-back, in contrast to BTC and SHIB, even though the RSI hit oversold. The bounce is shallow, feeble and far from creating structure.
The price difference from the declining moving averages is the main cause for concern. Instead of curling back toward them, ETH is sliding beneath them. According to trend logic, trapped longs panic-sell into weakness, which frequently results in a second, sharper drop than the first.
Shiba Inu stabilizes
After weeks of sharp declines, Shiba Inu is now showing the first indications of structural stabilization. Although there is not yet a complete reversal structure, the most recent price action is creating a rounding pattern close to the lows, which is sufficient to indicate that the downtrend may be waning.
This shift was accelerated by the oversold RSI. During the most recent decline, SHIB recorded one of its lowest RSI readings of the year; in the past, these readings have led to brief recoveries. The lack of follow-through sales immediately following oversold levels suggests that sellers are beginning to lose motivation. SHIB would have continued to bleed below the $0.0000075 zone if the trend had remained strong; instead, we are witnessing a slight upward curve.
Investors should anticipate a gradual stabilization rather than an instantaneous V-shaped reversal from this point on. Because they depend on sentiment gradually changing from fear to indifference to cautious accumulation, rounding bottoms take time. Only when the price begins to build higher lows on brief time frames — which seems to be happening right now — does that shift become apparent.
The $0.0000075-$0.0000080 support band should be held. The rounding structure gains credibility and indicates a stop to the downtrend if buyers defend this range. SHIB must recover short-term moving averages before the downward trend reverses.
A close above the 20-day creates room for $0.0000092 to $0.0000100. The real resistance is still the long-term declining trendline between $0.0000105 and $0.0000110. SHIB can only transition from stabilization to recovery with a breakout there.
Disclaimer: The content of this article solely reflects the author's opinion and does not represent the platform in any capacity. This article is not intended to serve as a reference for making investment decisions.
You may also like
XRP News Today: "Institutions Show Confidence While Whales Stir Uncertainty: Will XRP Reach $2.60 or Falter?"
- XRP rebounded from $2 support, with analysts targeting $2.60 as a key resistance level within a descending channel. - Institutional adoption grew via new XRP ETFs and Standard Chartered's custodial role, though ETFs hold just 0.5% of XRP's market cap. - Whale selling pressure (200M XRP in 48 hours) and bearish technical indicators below $2.20–$2.52 challenge bullish momentum. - Regulatory uncertainty and unresolved Ripple litigation keep XRP's trajectory dependent on technical execution and macro develop

Unpacking the Rise of MMT Token TGE: Is This a Fresh Driver for Digital Asset Adoption?
- Momentum (MMT) Token's 2025 TGE triggered extreme volatility, surging to $4.47 before an 86.6% drop, exposing speculative market fragility and centralized ownership risks. - Institutional backing (Coinbase, Circle , OKX) and $600M TVL support MMT's DeFi role through RWA tokenization and CLMM liquidity models, despite structural volatility challenges. - 2025 macroeconomic tailwinds (rate cuts, inflation hedging) and regulatory clarity (CLARITY Act, MiCA 2.0) enhance institutional trust, aligning with cryp
Bitcoin Updates: Federal Reserve's Softer Stance and ETF Investments Drive Bitcoin's Recovery to $91,000
- Bitcoin surged above $91,000 in December 2025 as Fed rate-cut odds hit 70%, driven by dovish signals and ETF inflows reversing outflows. - Technical indicators showed oversold RSI levels and seller exhaustion, while altcoins like XRP/ZEC jumped 7.7%-17% amid $2.95T market cap growth. - Institutional flows favored Solana ETFs and altcoin products, but MSCI's crypto exclusion policy sparked backlash from advocates like Michael Saylor. - Retail fear metrics and $605M liquidations highlighted fragility, yet

Ethereum Updates Today: Institutional Investments Rise While Prices Remain Flat: The Challenge of Ethereum's Potential Breakout
- Ethereum's MVRV Z-Score (0.29) signals potential buying opportunities amid prolonged accumulation and institutional ETF inflows. - Retail investors reduced exposure while whales (10K+ ETH) accumulated, contrasting with $92M ETH ETF inflows on Nov 24. - BlackRock's staked ETH ETF filing threatens DATs' opaque fee models as ETH price struggles to reclaim $2,800 despite technical buildup. - Divergent ETF flows ($88M ETHA inflow vs. $53M outflow) highlight market volatility, with analysts eyeing $9K breakout