
Is Crypto in a Bear Market Now? A Full Market Structure Assessment

Bitcoin’s breakdown below its long-term support has raised fears of a new bear market. On-chain and sentiment data show stress, but the cycle remains unconfirmed.
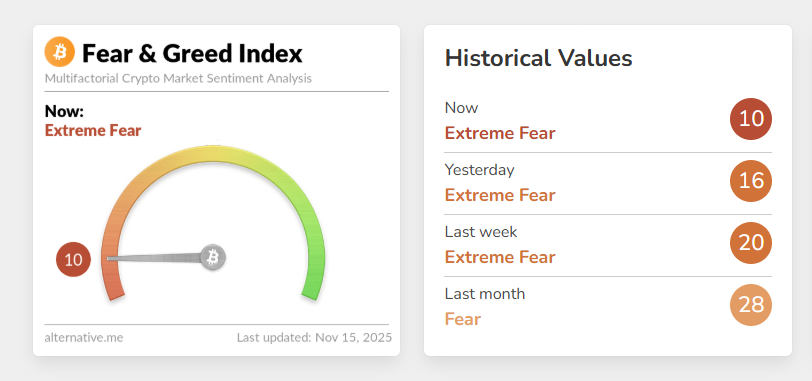
Bitcoin has dropped below $100,000 for the second time in a week, losing 12% in a month. The overall crypto market has lost over $700 billion in the past month, as the Fear and Greed Index has fallen to ‘extreme fear’.
So, do all of these market indicators signal a bear market? Let’s analyze the technical and historical data.
Sentiment Signals Are at Bear-Market Levels
The Fear & Greed Index at 10 reflects extreme fear comparable to early 2022 and June 2022, both confirmed bear-market phases.
- Yesterday: 16
- Last week: 20
- Last month: 28
The trend shows accelerating fear, not stabilizing sentiment. Bear runs usually begin with this kind of persistent fear compression.
However, sentiment alone does not confirm a bear market — it only signals capitulation or exhaustion.
 Crypto Fear & Greed Index. Source:
Bitcoin Has Broken Its Most Important Bull-Market Support
The 365-day moving average is the long-term structural pivot.
Current situation:
- The 365-day MA is near $102,000.
- Bitcoin is trading below it.
- The breakdown mirrors December 2021, when price lost the same MA and the bear market started.
Historically:
| Cycle | MA Lost? | Outcome |
| 2018 | Yes | Full bear market |
| 2021 | Yes | Full bear market |
| 2025 | Yes (now) | Bear-phase risk rising |
Failing to reclaim this level quickly often confirms a cycle regime shift. This is one of the strongest technical arguments for a bear-market transition.
Bitcoin "Death Cross" Just Flashed!The Death Cross (An ironically BULLISH indicator) has just triggered, EXACTLY timed with BTC tagging the lower boundary of the megaphone pattern it's in.Several weeks ago we predicted this would happen around mid-November. Well, here we are.…
— 𝙲𝚘𝚕𝚒𝚗 𝚃𝚊𝚕𝚔𝚜 𝙲𝚛𝚢𝚙𝚝𝚘 🪙 November 15, 2025
On-Chain Cost Basis Shows Early Capitulation, Not Distribution Top
The 6–12 month UTXO (Unspent Transaction Output) realized price now sits around $94,600. Bitcoin price currently stands slightly above this level.
This matters because:
- These holders bought during the ETF rally.
- They represent “bull-cycle conviction buyers.”
- When their position enters loss, market structure weakens.
In 2021, Bitcoin price falling below this cohort’s cost basis was one of the final signals before the extended downtrend. This is the first time that cost-basis stress has reappeared since 2022.
This supports the idea of a mid-cycle break, not yet a full macro bear trend.
BULL MARKETS DON’T END LIKE THIS!I’ve been around for multiple bull/bear markets,2001 dotcom, 2008 housing, 2017 crypto , 2021 crypto etc etc.When bull markets end , either something breaks or belief in the asset/ market crumbles.In 2001, people really doubted the…
— Ran Neuner November 15, 2025
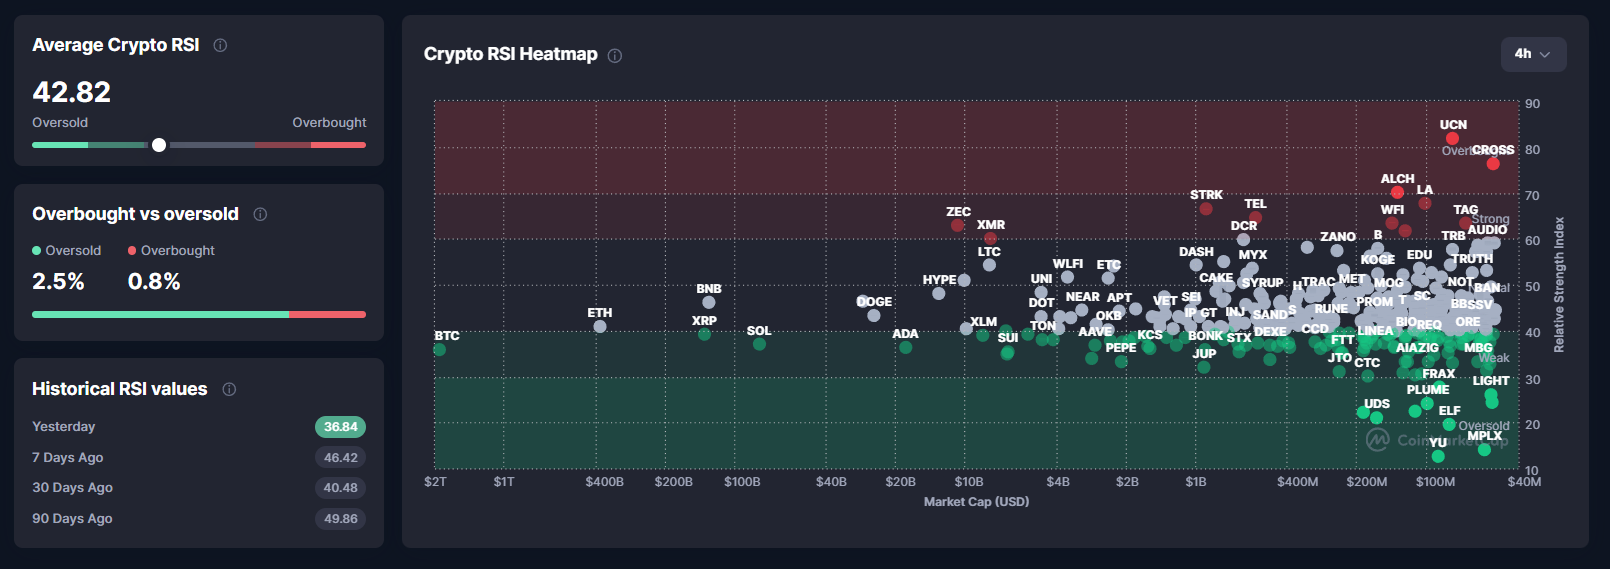
RSI Shows Oversold Conditions, Typical of Mid-Cycle Crashes
Market-wide RSI readings:
- Average crypto RSI: 43.09
- BTC RSI is among the lowest in large caps
- Only 2.5% of assets are overbought
- Most are in oversold territory
 Crypto Market Average RSI. Source:
This resembles May–July 2021, August 2023, and August 2024. Each was a mid-cycle correction, not an end-of-cycle bear. When RSI stays deeply oversold for weeks, bearish momentum confirms.
Right now, RSI shows stress but not yet trend reversal.
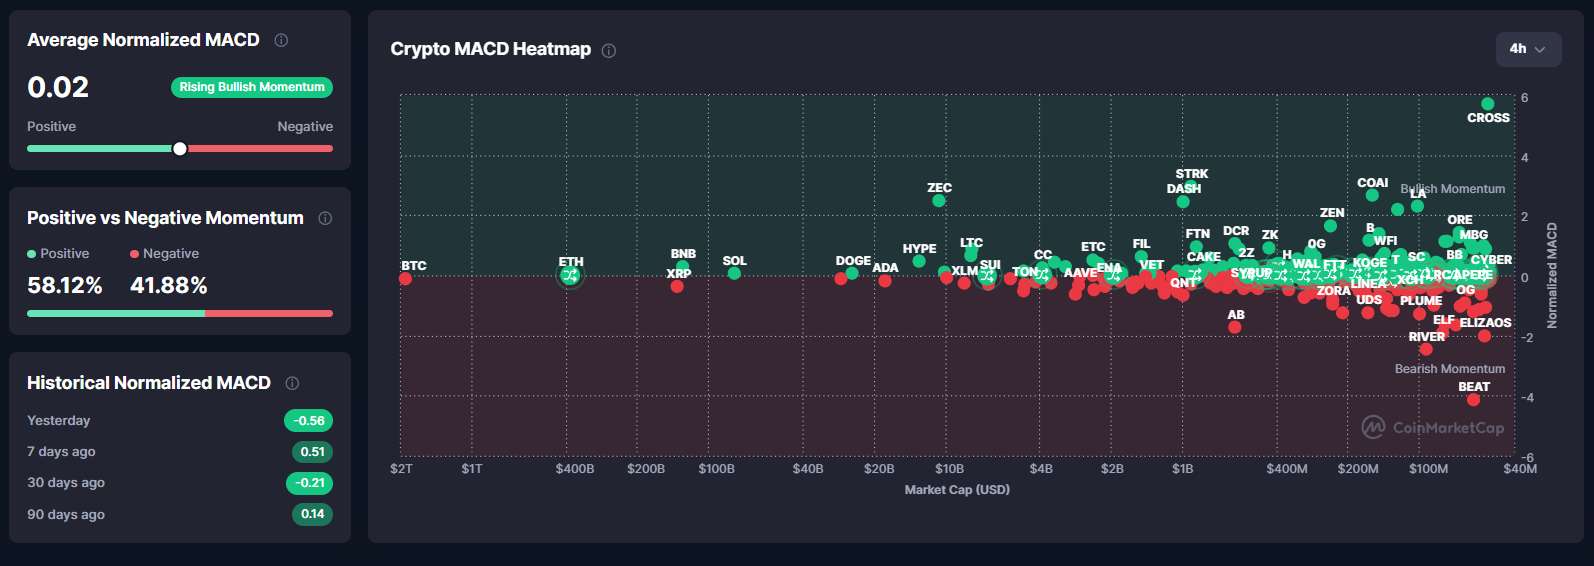
MACD Shows Strong Divergence Across the Market
The average normalized MACD is currently 0.02. This indicates weak bullish momentum returning. Also, 58% of the market assets have positive momentum.
Bitcoin, however, sits deep in the negative zone while altcoins are mixed.
 Crypto Market Average MACD (Moving Average Convergence Divergence). Source:
When BTC has negative MACD but the market still has 50%+ positive momentum, the market is in a transition phase rather than a full bear trend.
In full bear markets, 90%+ of assets show negative MACD simultaneously. Right now, that is not the case.
So, Is This a Bear Market?
The crypto market is not in a confirmed bear market — it is in a mid-cycle breakdown with a rising probability of becoming a bear market if two conditions are met.
These are the three conditions that would confirm a bear run:
- Bitcoin remains below the 365-day MA for 4–6 weeks. This triggered every bear market in 2014, 2018, and 2022.
- Long-term holders continue heavy distribution. If LTH (long-term holder) selling exceeds 1M BTC over 60 days, the cycle top is in.
- MACD flips fully negative across the entire market. We are not there yet.
TBH this is the easiest bear market I've ever seen.Seems like most of you have forgotten what 2022 was like. Luna collapsing, then 3AC, then FTX, then Genesis, BlockFi, Axie, NFTs–pretty much everything felt like a house of cards.And then after all that stuff collapsed, the…
— Haseeb >|< November 14, 2025
Overall, crypto is not yet in a bear market, but the current breakdown puts the market in a high-risk zone where a bear market could form if Bitcoin fails to reclaim long-term support soon.
Disclaimer: The content of this article solely reflects the author's opinion and does not represent the platform in any capacity. This article is not intended to serve as a reference for making investment decisions.
You may also like
Solana News Update: Major Investors Place Significant Bets on Solana ETFs Amid 30% Price Drop, Challenging the Strength of $130 Support
- Solana's ETFs (BSOL/FSOL) drew $476M in 17 days despite SOL's 30% price drop to $130, signaling institutional confidence. - $130 support level shows buying pressure with RSI rising to 50, though $160 EMA remains a key reentry target for bulls. - On-chain growth (18% active address rise) and projects like GeeFi reinforce Solana's infrastructure, but $140 resistance remains fragile. - Mixed futures signals (5% higher OI, positive funding rates) highlight uncertainty, with $120 as next potential downside ri

PEPE Balances on a Fine Line: Key Support at $0.0547 and Resistance at $0.05504 Under Scrutiny
- PEPE cryptocurrency stabilized above $0.0547 support, trading within a narrow range as of mid-November 2025. - Technical indicators show neutral sentiment with RSI at 50.62 and MACD near zero, per xt.com and BitGet analyses. - Whale movements and exchange flows drive volatility, while long-term forecasts range from 140,000% to 28.6 million% gains by 2030-2050. - Market depends on meme culture relevance, institutional adoption, and broader crypto trends like Ethereum's price and ETF regulations.
Bitcoin Updates Today: Kiyosaki Turns Bitcoin Profits into Ongoing Income, Living by His Own Advice
- Robert Kiyosaki sold $2.25M in Bitcoin at $90,000/coin, reinvesting in surgical centers and billboards for tax-free income. - He aims for $27,500 monthly cash flow by 2026, aligning with his passive-income strategy while maintaining Bitcoin's $250K/2026 price target. - Bitcoin's 33% drop from $126K peaks reflects broader market slump driven by Fed rate uncertainty and offshore trading pressures. - Kiyosaki advocates gold/silver and warns of systemic risks, contrasting with analysts who see intact fundame

Bitcoin Updates: Abu Dhabi and Major Institutions Drive Bitcoin Accumulation Strategy for 2025
- Max Keiser argues Bitcoin is entering a critical accumulation phase, with institutional ETF inflows and Abu Dhabi’s strategic buy-ins signaling potential for a 2025 all-time high. - Technical analysis highlights $84,243 support and $86,700–$89,900 resistance, with sustained ETF inflows potentially pushing BTC past $90,000. - Over 95% of Bitcoin ETF assets are held by investors aged 55+, stabilizing the market during corrections and cushioning declines. - Despite short-term volatility, ETF-driven liquidit
