Zcash Price Attempts a Breakout As Selling Eases 85% — Is This A New Rally?

Zcash price is down about 2.2% today, but the chart shows something more important than the small dip. After a three-month gain of more than 1278%, the price has cooled without breaking its broader structure. At the same time, selling pressure has collapsed by 85%, which is not obvious at first glance. This combination has
Zcash price is down about 2.2% today, but the chart shows something more important than the small dip. After a three-month gain of more than 1278%, the price has cooled without breaking its broader structure. At the same time, selling pressure has collapsed by 85%, which is not obvious at first glance.
This combination has created the first signs that ZEC might try to restart its larger move despite the recent pullback.
Flag Breakout Attempt Needs a Clean Close to Confirm
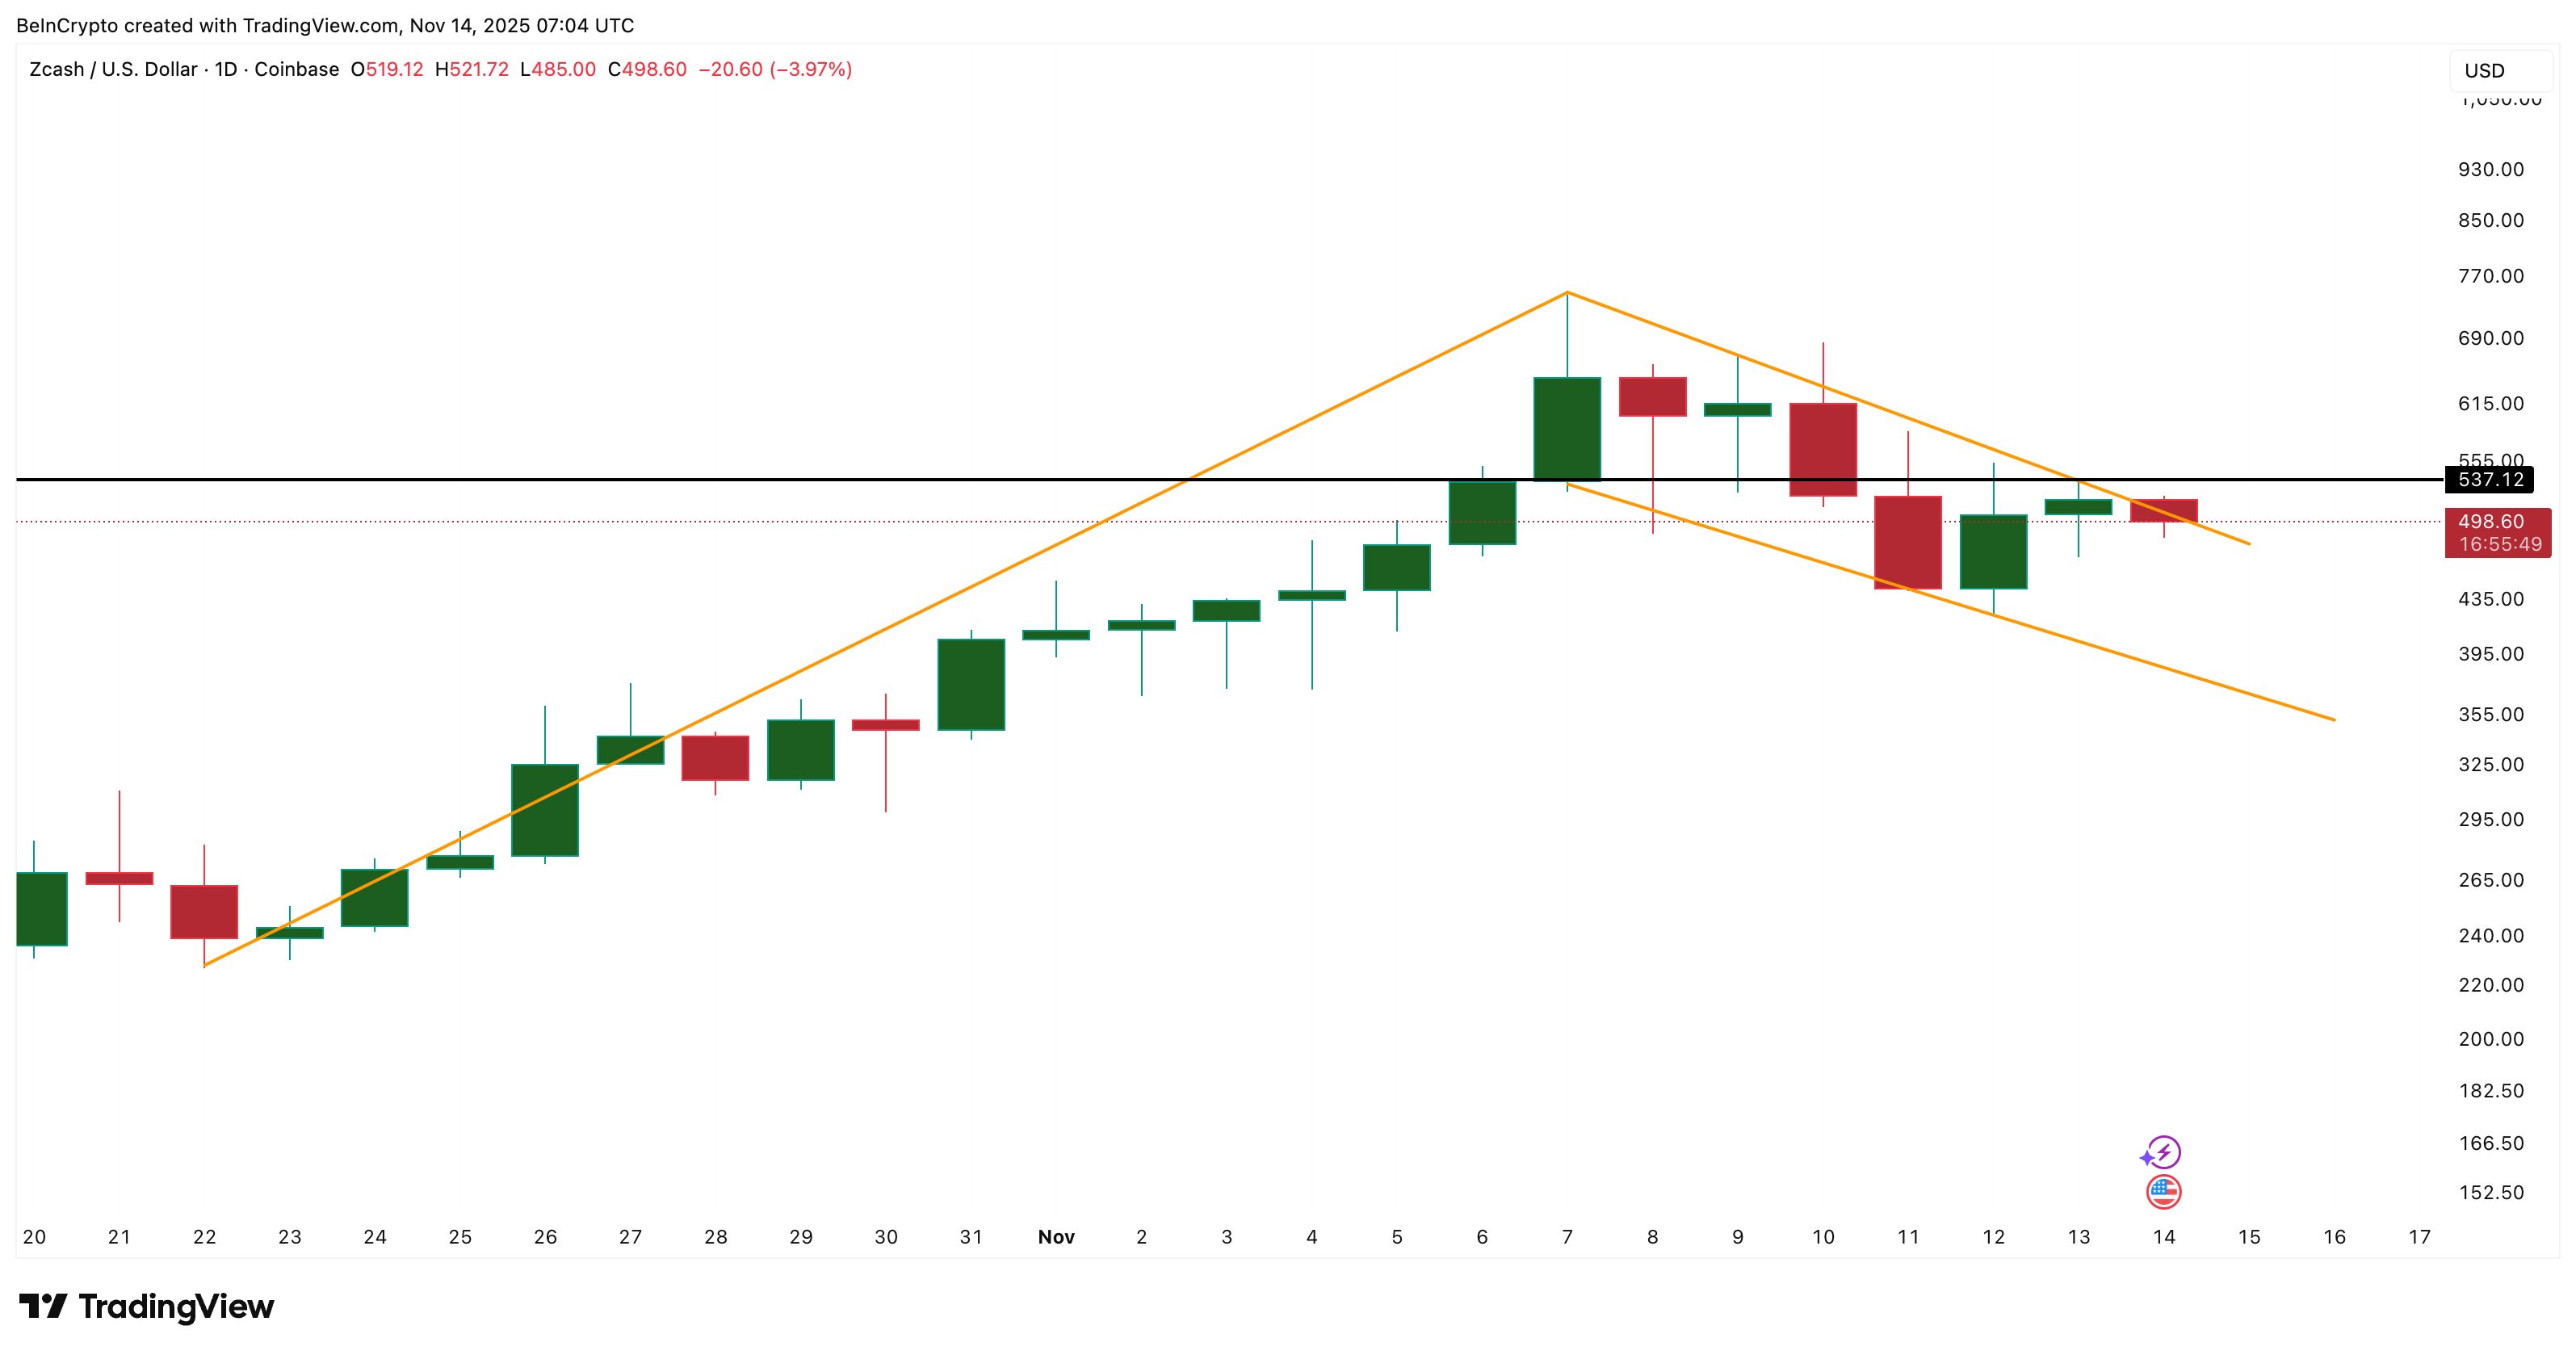
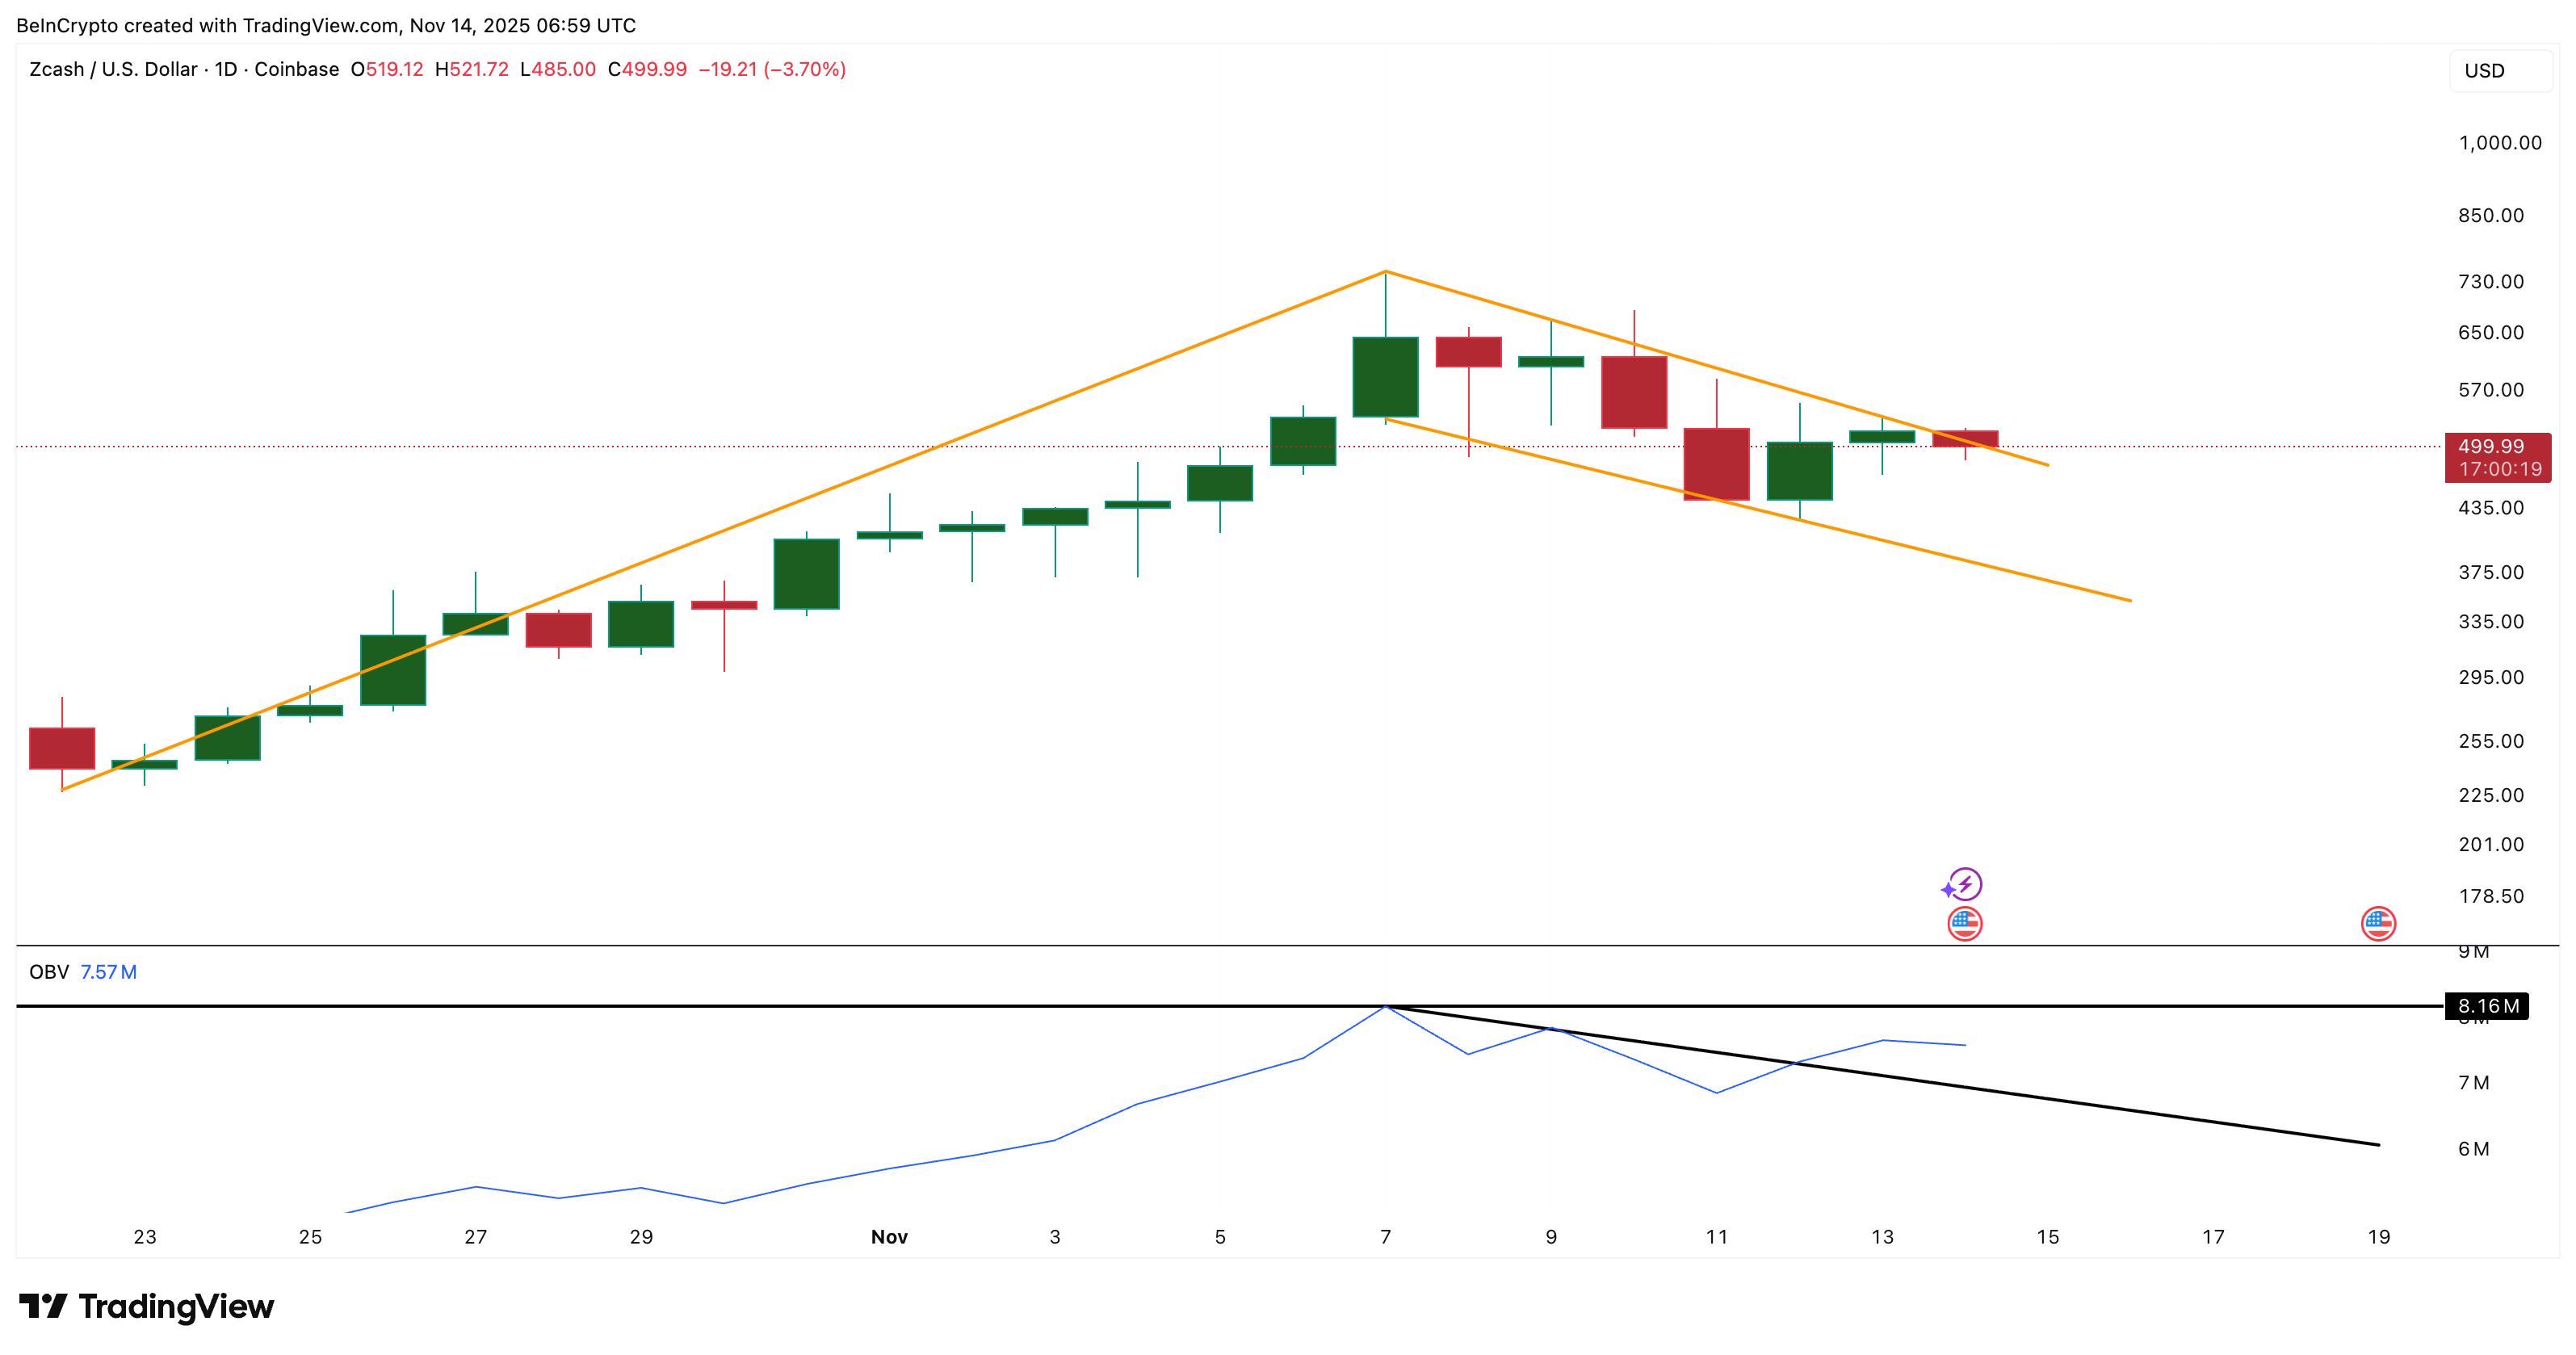
ZEC spent the last week forming a falling flag after the sharp rally from late October. A falling flag is a short corrective pattern that often appears after a long upward move. Price has now pushed above the flag’s upper trendline, but the breakout is not confirmed yet. For the move to gain strength, ZEC needs a daily close above $537, the level where the breakout line and horizontal resistance meet.
 Zcash Price Attempts A Breakout:
TradingView
Zcash Price Attempts A Breakout:
TradingView
Want more token insights like this? Sign up for Editor Harsh Notariya’s Daily Crypto Newsletter.
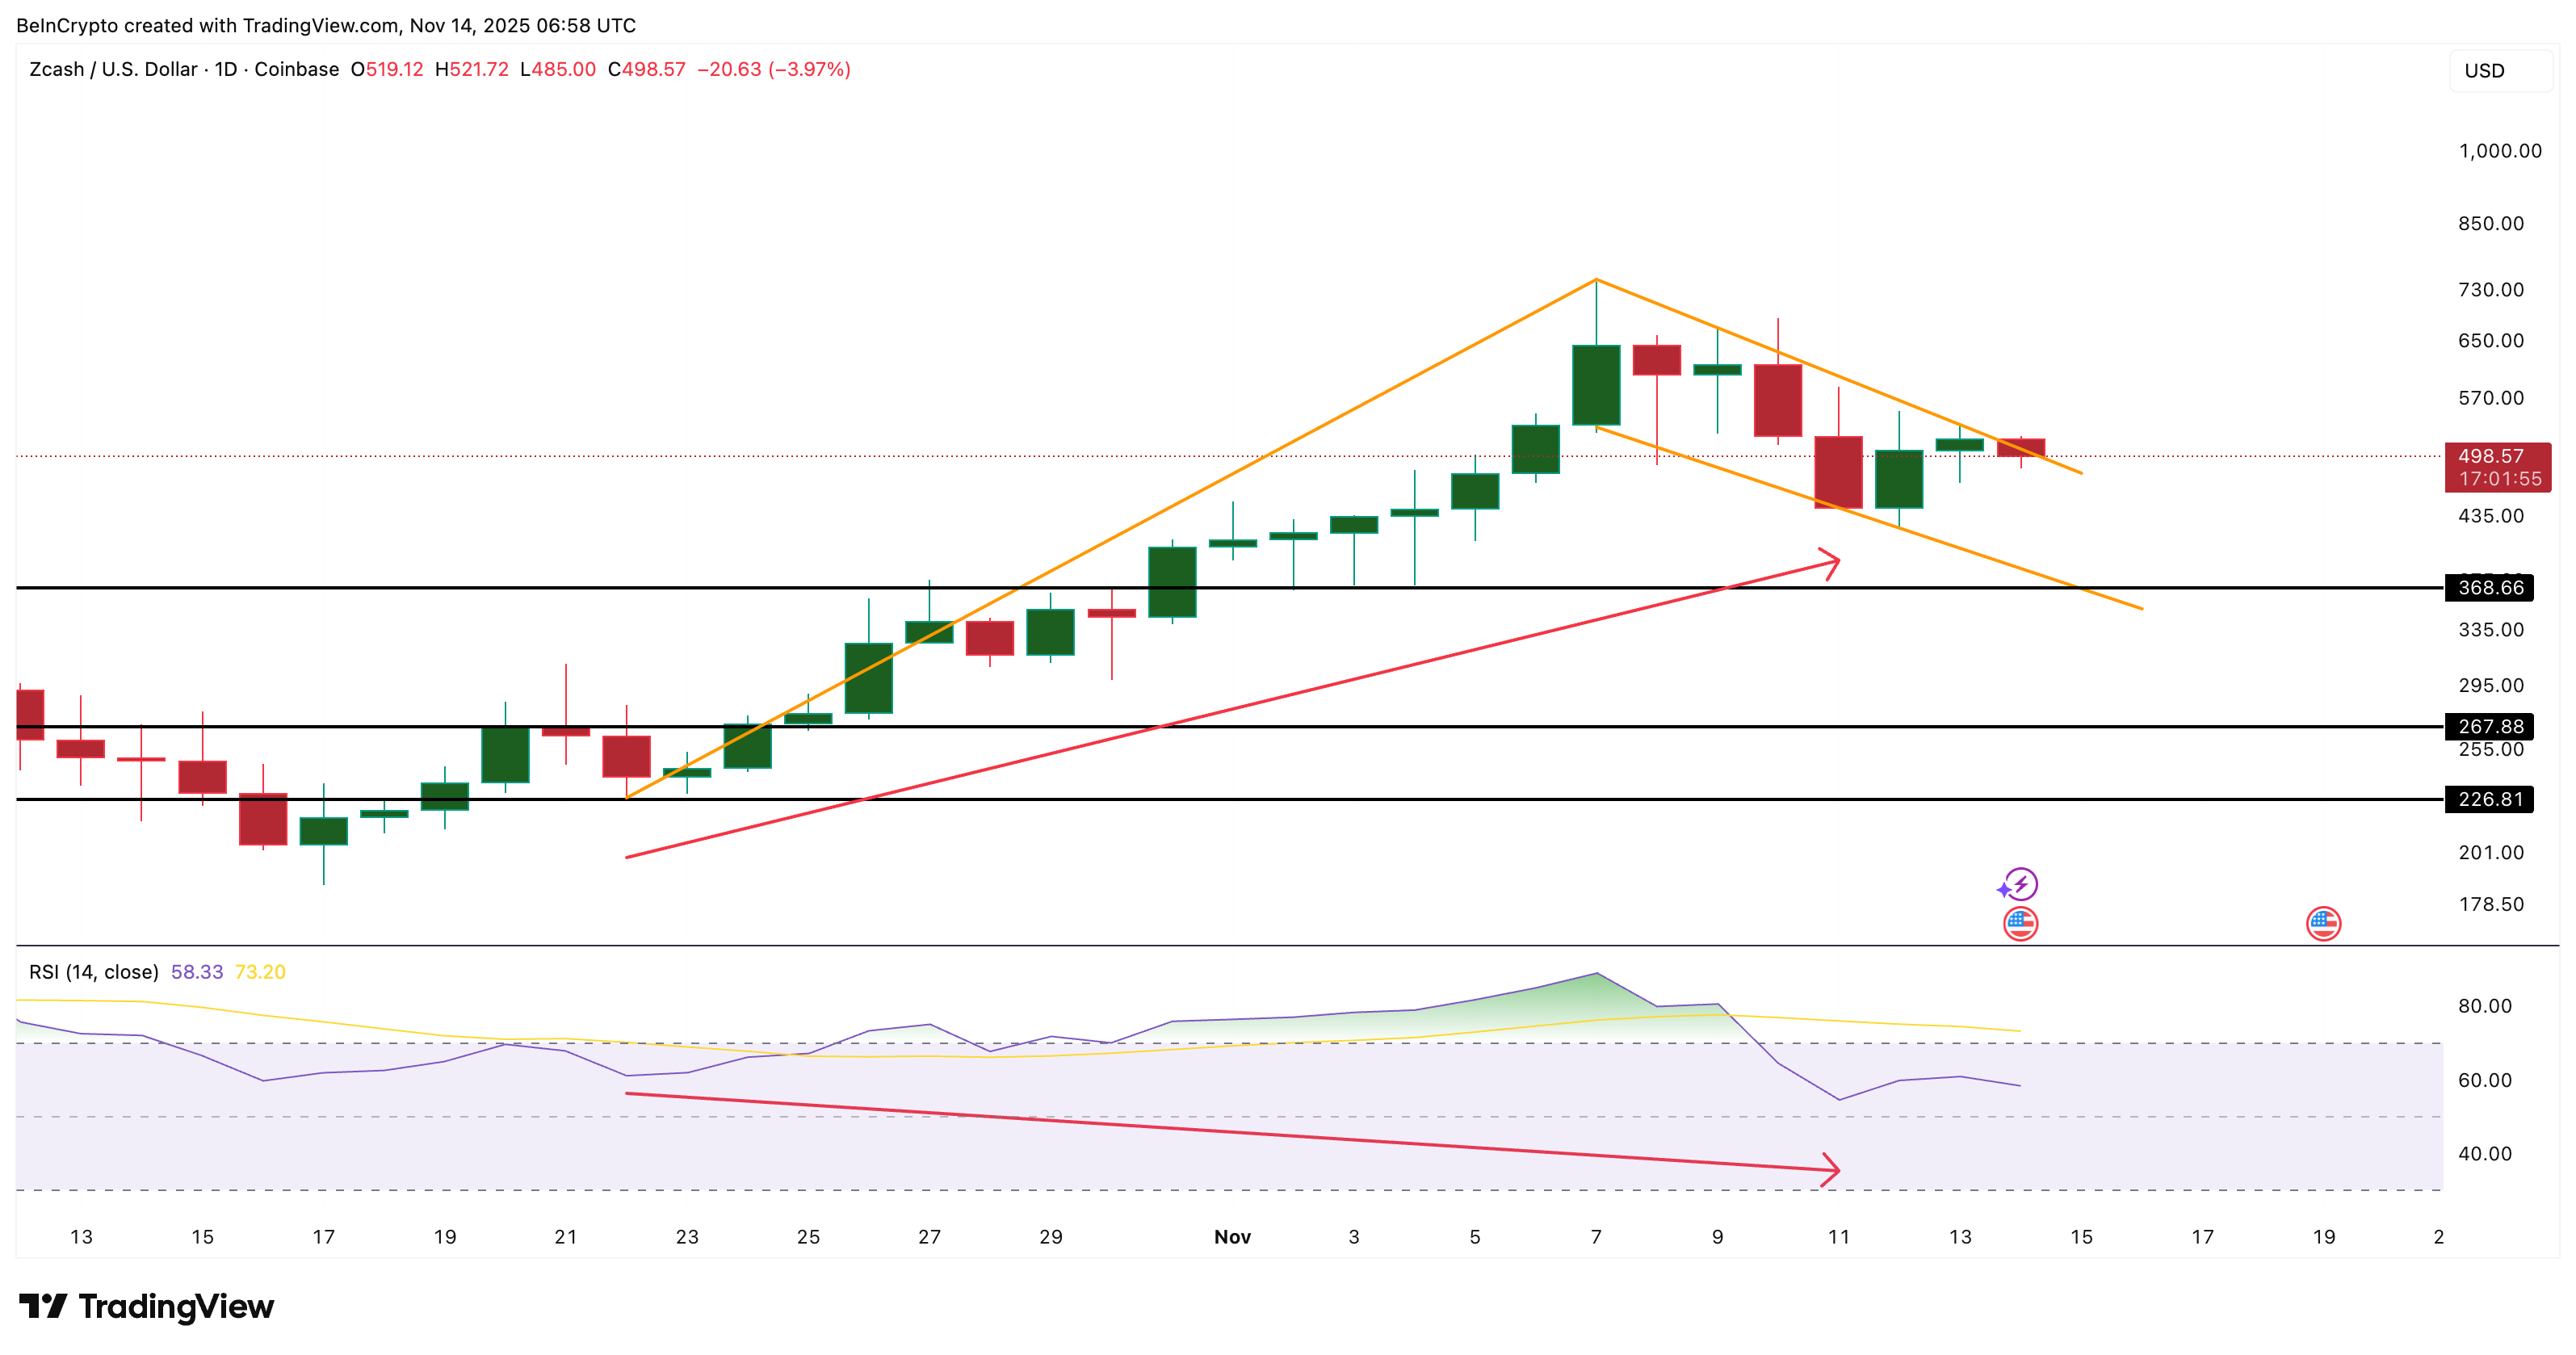
The broader trend remains healthy because the recent low stayed above the previous major low. This is supported by the RSI. The Relative Strength Index measures the speed of price changes, and it has formed a hidden bullish divergence. Between 22 October and 7 November, ZEC made a higher low, but RSI made a lower low.
 Hidden Bullish Divergence:
TradingView
Hidden Bullish Divergence:
TradingView
Hidden bullish divergence usually appears in strong uptrends when momentum cools before continuing higher. In simple terms, it tells us the larger move is not broken yet.
If the ZEC price breakout attempt closes above $537, it can open the next leg of the rally.
Selling Pressure Drops Sharply as Volume Trends Stabilize
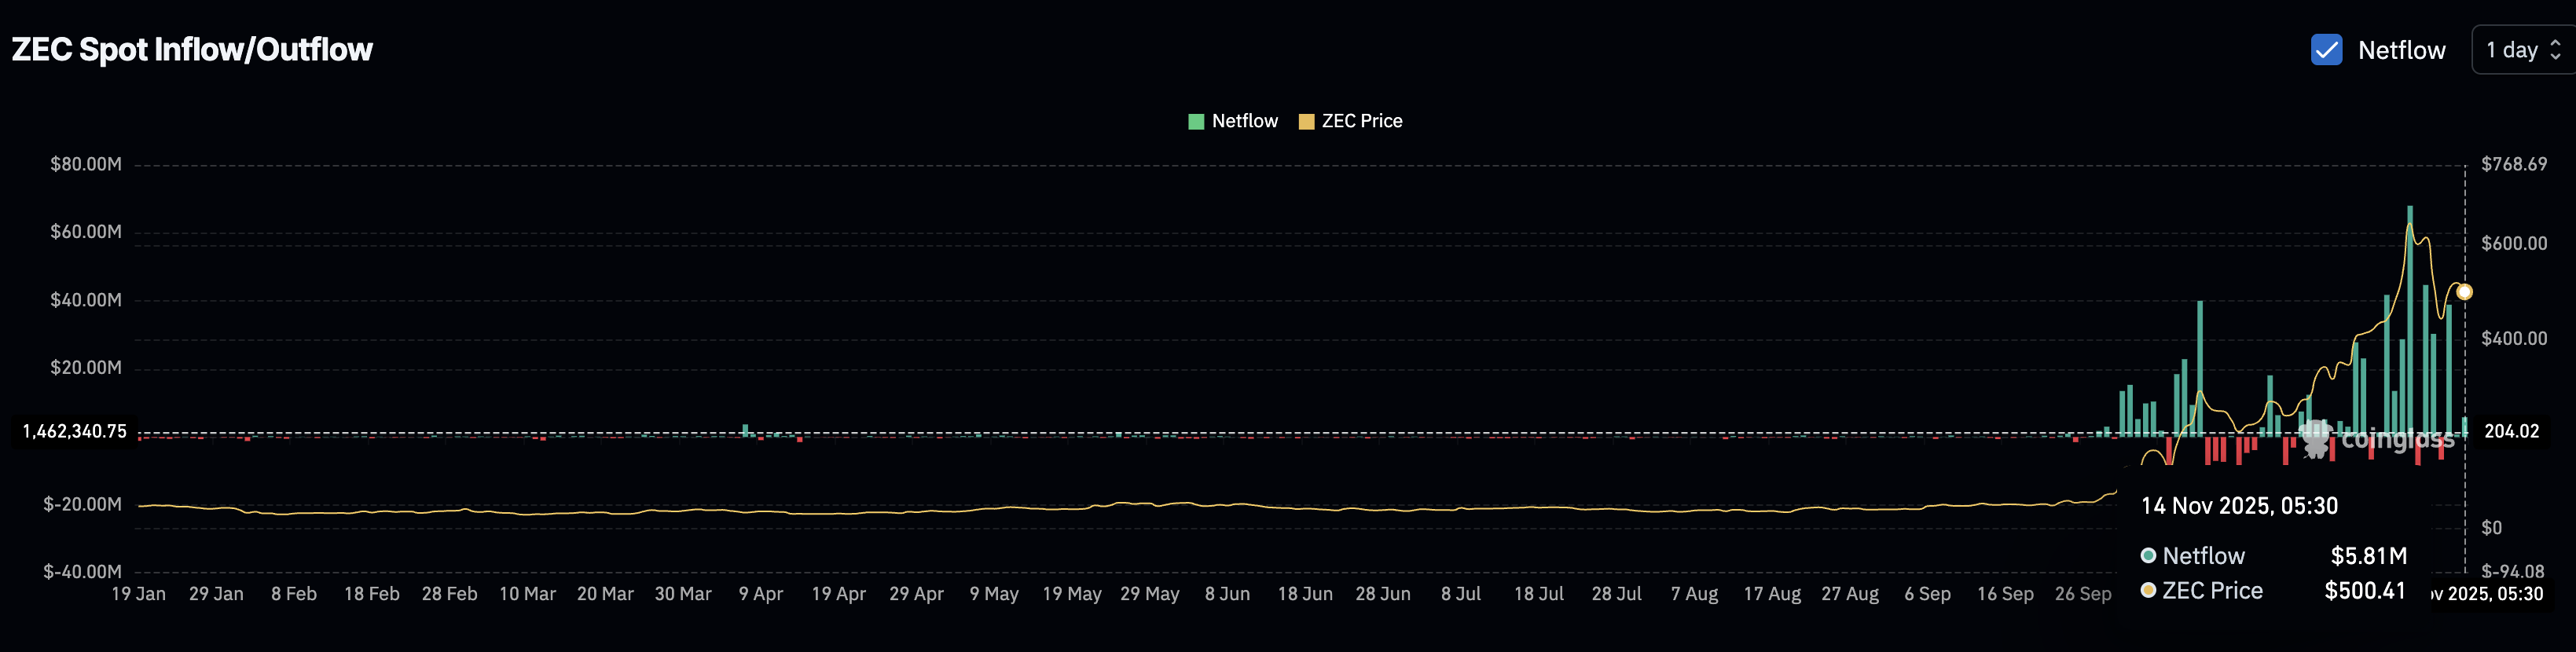
The biggest shift is in selling pressure. Exchange spot netflows peaked at $38.91 million on 12 November, showing heavy inflows earlier in the move. But today, the inflows have fallen to $5.81 million. That is an 85% drop in selling pressure, which lines up with the attempt to break out of the flag.
 Sellers Losing Interest:
Coinglass
Sellers Losing Interest:
Coinglass
The On-Balance Volume (OBV), which tracks whether trading volume is mostly happening on up days or down days, also supports the cooling pressure.
OBV has broken above the descending trendline, which is bullish and shows a volume-backed breakout attempt. Yet, the line has flattened and now sits close to 8.16 million. A push above that level would confirm a shift from selling to buying pressure. Until then, the ZEC selling trend is weak but not fully reversed.
 ZEC Price Finds Volume Support:
TradingView
ZEC Price Finds Volume Support:
TradingView
The message from the volume side is clear. Selling has eased sharply. Buyers are not aggressive yet, but the pressure against the ZEC price is much lighter than it was two days ago.
Key Zcash Price Levels Decide Whether the Rally Continues or Fades
The Zcash price now sits near $502, right between support and resistance. A confirmed close above $537-$538 is the trigger for continuation. If that happens, ZEC can move toward $612, $688, $749, and even higher levels if momentum returns, especially with volume support.
 Zcash Price Analysis:
TradingView
Zcash Price Analysis:
TradingView
The nearest Zcash price support sits at $488. If that level fails, the next support appears at $368.
This level protected the price during the earlier phases of the rally. Falling below $488 would weaken the breakout idea. A drop under $368 would invalidate the pattern and point to a deeper pullback.
Read the article at BeInCryptoDisclaimer: The content of this article solely reflects the author's opinion and does not represent the platform in any capacity. This article is not intended to serve as a reference for making investment decisions.
You may also like
Bitcoin Updates Today: Is Crypto’s Intense Fear Signaling a Market Bottom or Just a Misleading Decline?
- Crypto Fear & Greed Index fell to 24, with Bitcoin consolidating between $103,000-$115,000 amid prolonged market anxiety. - Extended fear periods historically precede market bottoms, but traders warn the index often lags and misfires in volatile conditions. - Coinbase aims to stabilize markets with 24/7 altcoin futures, yet regulatory clarity and persistent ETF outflows remain critical factors.
Bitcoin News Update: Bitcoin ETFs See $2.96 Billion Outflow as November Optimism Wanes
- BlackRock's Bitcoin ETFs lost $523M in single-day outflows on Nov 17, marking fifth consecutive net redemptions totaling $2.96B for November. - Despite November's historical 41.22% Bitcoin price surge, ETF redemptions signal cooling institutional/retail demand with average investor cost basis at $89,600. - Michael Saylor's firm bought 8,178 BTC at $102k average price, while JPMorgan warned Bitcoin-heavy companies risk index delistings by 2026. - BlackRock's IBIT holds 3.1% of Bitcoin supply but NAV multi
Bitcoin Updates: ECB Advocates for Digital Euro While Bitcoin's Decline Faces Regulatory Barriers
- ECB President Lagarde reaffirmed Bitcoin's "worth nothing" stance, rejecting its inclusion in central bank reserves due to safety and regulatory risks. - Bitcoin fell below $90,000 (32% from October 2025 peak), mirroring April 2025's correction amid U.S. rate uncertainty and large holder sell-offs. - ECB prioritizes digital euro development, aiming for 2027 pilot and 2029 launch to enhance privacy and reduce reliance on foreign payment systems. - Despite short-term Bitcoin rebound (3.64% in 24 hours), an
Ethereum News Update: Altcoins Face Critical Juncture—December Turning Point May Spark Market Recovery or Downturn
- Altcoins like ETH, XRP , and ICP trade near critical technical levels as institutional investors monitor potential inflection points ahead of a possible December market rebound or collapse. - Ethereum remains fragile below key moving averages with RSI near oversold territory, while XRP faces a $2.07–$2.10 support test that could trigger further declines if broken. - Smaller-cap tokens show speculative activity amid consolidation, with ICP's $4.97 resistance and Bitcoin's $88,000 support level serving as