Solana: Maximum pressure on key thresholds

Stuck in a symmetrical triangle since mid-September, Solana’s price reflects a war of attrition between buyers and sellers. Neither side gives up. But technical and on-chain signals converge: this stalemate is coming to an end. The next breakout could well decide SOL’s fate for the coming weeks.
In brief
- Long-term holders’ sales have dropped by 60% since early October, falling from 11.43 million SOL to 4.55 million.
- Holders from 1 to 3 months increased their share from 15.21% to 18.66%, signaling a silent accumulation.
- The symmetrical triangle tightens around two critical thresholds: $211 upwards and $174 downwards.
Solana on the brink of a break between buyers and sellers
Analysis of blockchain data reveals a notable shift in investment strategies. The net position change indicator shows that long-term holders continue to sell, but at a significantly slower pace. This 60% deceleration often serves as a precursor signal of reversal near local lows.
Short-term traders are also adjusting their approach. Between October 9 and 23, wallets holding SOL for less than a month significantly reduced their exposure. This contraction reflects opportunistic profit-taking during brief rebounds.
Meanwhile, a category of investors emerges as a stabilizing force: those holding positions between 1 and 3 months. Their share increased by nearly 23%, demonstrating confidence in discreet accumulation during pullbacks. This dynamic explains why Solana maintains its range without collapsing abruptly.
The macro context reinforces this cautious optimism. Gracy Chen, CEO of Bitget, anticipates that ” SOL aims for 210-220 dollars, supported by the expansion of DeFi activity and validator growth “.
She also emphasizes that ” regulatory thaw and favorable liquidity winds fuel renewed optimism towards cryptos“, creating one of the most constructive environments for the sector in recent years.
A symmetrical triangle that signals the direction
On the daily chart, Solana has been moving within a symmetrical triangle since mid-September. Each peak is lower, each trough higher. This compression reflects the market’s total indecision. But history teaches us that a triangle always ends up bursting one way or another.
Two levels now define the battlefield. A breakout above $211 would give buyers the advantage and mark the exit through the top of the triangle. Conversely, a breakdown below $174 would confirm sellers regaining control.
Between these two bounds, $197 is the first resistance to watch, while $188 remains the key support. A close below $188 would open the way to $174. A rebound above $197 could trigger an acceleration towards $211, a potential gain of over 9%.
In this context, Solana is also trying to regain its leadership in decentralized finance. With Percolator, its new perpetual contract DEX , the ecosystem fights back against Hyperliquid and Aster. This technological battle could influence market perception and attract new capital if the execution follows.
The battle between buyers and sellers remains balanced , but the countdown has started. Charts and on-chain data agree: the next breakout is close. And it will be decisive.
Disclaimer: The content of this article solely reflects the author's opinion and does not represent the platform in any capacity. This article is not intended to serve as a reference for making investment decisions.
You may also like
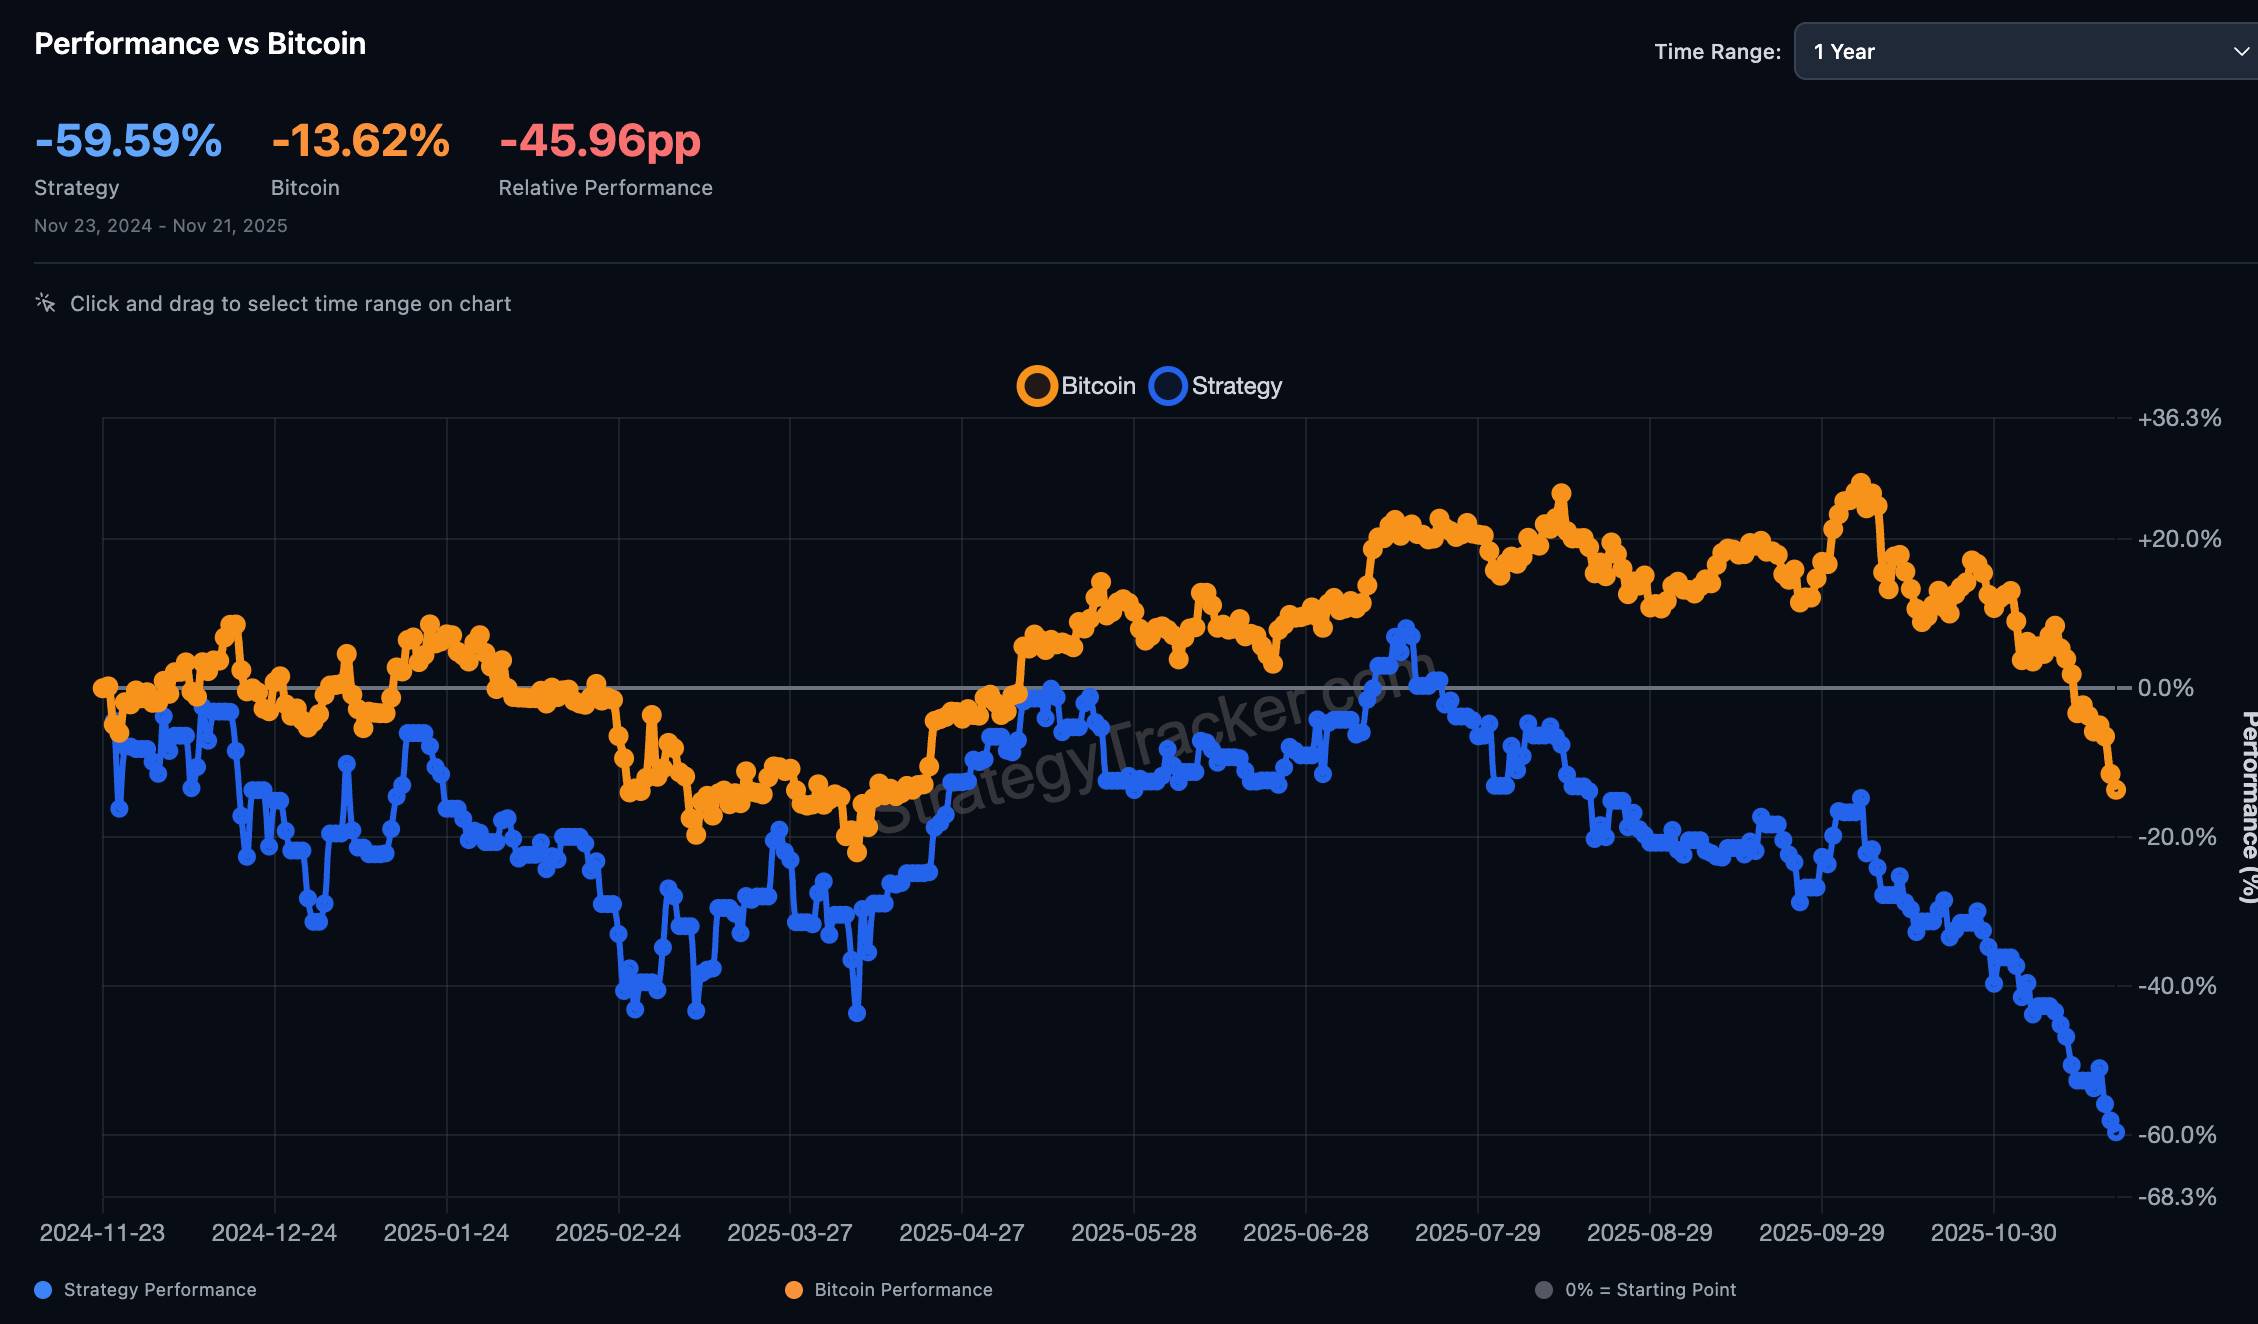
$8.8 billion outflow countdown: MSTR is becoming the abandoned child of global index funds
The final result will be revealed on January 15, 2026, and the market has already started to vote with its feet.
Deconstructing DAT: Beyond mNAV, How to Identify "Real vs. Fake HODLing"?
There is only one iron rule for investing in DAT: ignore premium bubbles and only invest in those with a genuine flywheel of continuously increasing "crypto per share."

Empowered by AI Avatars, How Does TwinX Create Immersive Interaction and a Value Closed Loop?
1. **Challenges in the Creator Economy**: Web2 content platforms suffer from issues such as opaque algorithms, non-transparent distribution, unclear commission rates, and high costs for fan migration, making it difficult for creators to control their own data and earnings. 2. **Integration of AI and Web3**: The development of AI technology, especially AI Avatar technology, combined with Web3's exploration of the creator economy, offers new solutions aimed at breaking the control of centralized platforms and reconstructing content production and value distribution. 3. **Positioning of the TwinX Platform**: TwinX is an AI-driven Web3 short video social platform that aims to reconstruct content, interaction, and value distribution through AI avatars, immersive interactions, and a decentralized value system, enabling creators to own their data and income. 4. **Core Features of TwinX**: These include AI avatar technology, which allows creators to generate a learnable, configurable, and sustainably operable "second persona", as well as a closed-loop commercialization pathway that integrates content creation, interaction, and monetization. 5. **Web3 Characteristics**: TwinX embodies the assetization and co-governance features of Web3. It utilizes blockchain to confirm and record interactive behaviors, turning user activities into traceable assets, and enables participants to engage in platform governance through tokens, thus integrating the creator economy with community governance.
Aster CEO explains in detail the vision of Aster privacy L1 chain, reshaping the decentralized trading experience
Aster is set to launch a privacy-focused Layer 1 (L1) public chain, along with detailed plans for token empowerment, global market expansion, and liquidity strategies.