Bitget App
Trade smarter
Buy cryptoMarketsTradeFuturesEarnSquareMore
Ethereum (ETH) to Decline Further? Key Pattern Formation on LTF Suggests So!

Ethereum (ETH) to Decline Further? Key Pattern Formation on LTF Suggests So!

CoinsProbeCoinsProbe2025/10/22 18:03
By:Nilesh Hembade

Date: Wed, Oct 22, 2025 | 05:50 AM GMT

The cryptocurrency market continues to show choppy momentum, with total 24-hour liquidations reaching $655 million. Of that, $354 million came from long positions while $301 million in shorts were wiped out — a clear sign of intense two-sided volatility.

Amid this turbulence, Ethereum (ETH) has turned red again, slipping back near $3,850 after hitting a 24-hour high of $4,109. The latest technical setup on its lower timeframe now suggests that further short-term downside could be on the horizon.

Ethereum (ETH) to Decline Further? Key Pattern Formation on LTF Suggests So! image 0 
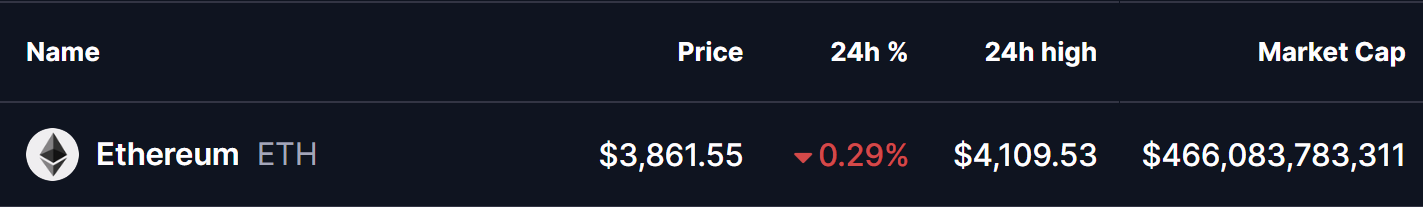
Source: Coinmarketcap

Descending Triangle Pattern in Play?

On the 4-hour chart, ETH appears to be consolidating within a descending triangle pattern — a formation often seen as a bearish continuation signal. This structure features a series of lower highs pressing down on a horizontal support base, indicating waning buying momentum.

The most recent rejection from the descending trendline near $4,037 has added pressure, pushing prices down to around $3,849. Sellers currently appear to be in control as ETH struggles to reclaim higher levels.

Ethereum (ETH) to Decline Further? Key Pattern Formation on LTF Suggests So! image 1 
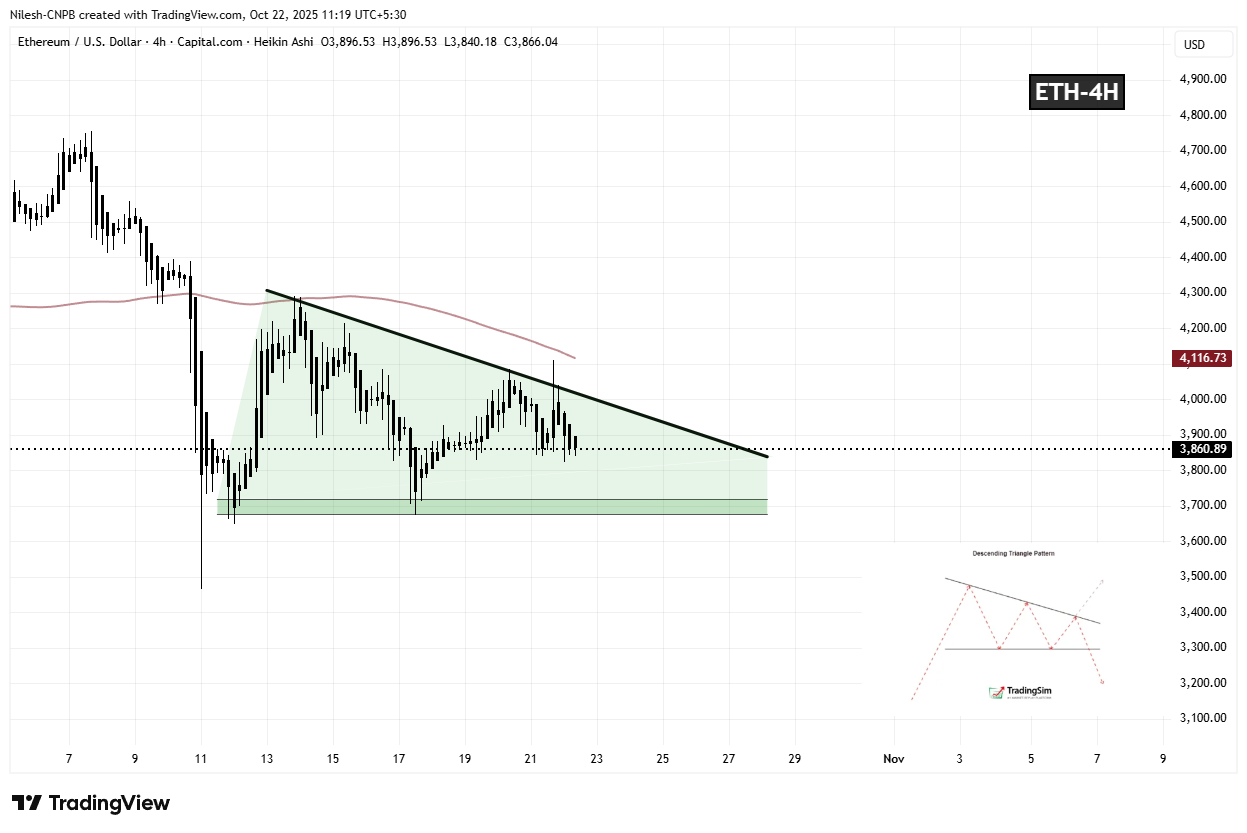
Ethereum (ETH) 4H Chart/Coinsprobe (Source: Tradingview)

What’s Next for ETH?

If downside pressure continues, a breakdown below the $3,822 support range could open the door for a deeper move toward $3,675, representing a potential 4.75% decline from current levels. This move could also weigh on the broader altcoin market, as Ethereum’s price action often influences overall sentiment.

However, if bulls manage to defend the $3,800–$3,820 zone, ETH could remain in consolidation before attempting another test of the descending resistance line. A confirmed breakout above that trendline could invalidate the bearish setup and reignite bullish momentum.

For now, the balance of risk leans slightly to the downside — but as always in crypto, volatility can quickly shift momentum in either direction.

0

Disclaimer: The content of this article solely reflects the author's opinion and does not represent the platform in any capacity. This article is not intended to serve as a reference for making investment decisions.

PoolX: Earn new token airdrops
Lock your assets and earn 10%+ APR
Lock now!

You may also like

This Week's Preview: BTC Returns to 86,000, Trump’s Epic Showdown with Major Shorts, Macro Turmoil Just Settled

After last week's global market panic and subsequent recovery, bitcoin rebounded to $86,861. This week, the market will focus on new AI policies, the standoff between bears and bulls, PCE data, and geopolitical events, with intensified competition. Summary generated by Mars AI. The accuracy and completeness of this summary, produced by the Mars AI model, are still being iteratively improved.

MarsBit2025/11/24 03:44
This Week's Preview: BTC Returns to 86,000, Trump’s Epic Showdown with Major Shorts, Macro Turmoil Just Settled

At risk of being removed from the index? Strategy faces a "quadruple squeeze" crisis

Strategy is facing multiple pressures, including a significant narrowing of mNAV premiums, reduced coin hoarding, executive stock sell-offs, and the risk of being removed from indexes. Market confidence is being severely tested.

BlockBeats2025/11/24 03:41
At risk of being removed from the index? Strategy faces a "quadruple squeeze" crisis

How to plan a perfect TGE launch?

Most TGE failures are not due to poor products or inexperienced teams, but because their foundations were never prepared to face public scrutiny, competition, and shifts in narrative.

ForesightNews 速递2025/11/24 03:33
How to plan a perfect TGE launch?