Date: Mon, Oct 20, 2025 | 09:10 AM GMT
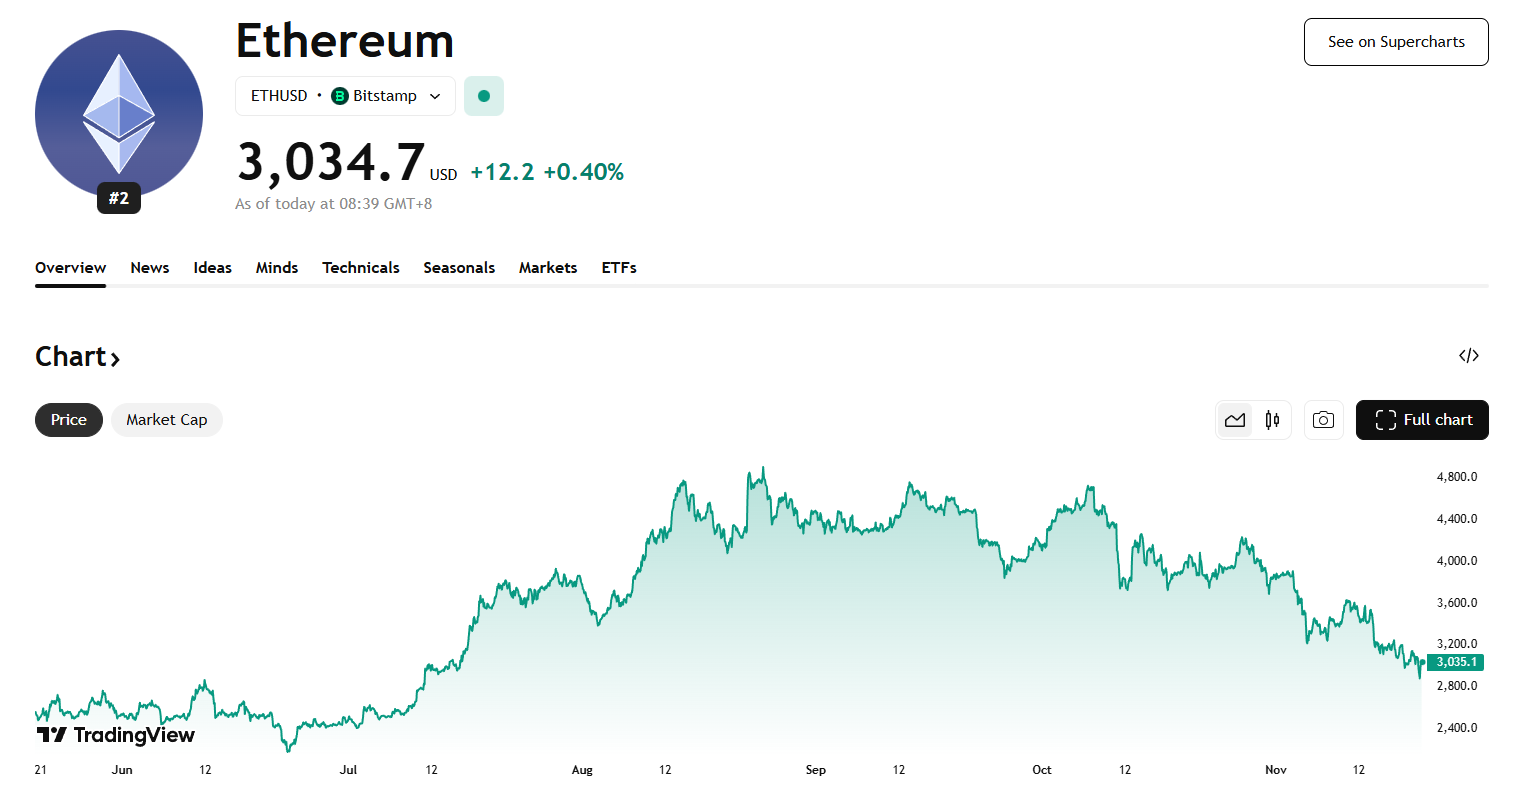
The cryptocurrency market is off to a strong start this week, recovering from last week’s choppy momentum. Both Bitcoin (BTC) and Ethereum (ETH) are trading in the green with more than 4% gains, lifting sentiment across the broader memecoins, including Dogecoin (DOGE).
DOGE has jumped by over 7% today, extending its recent rally as a harmonic pattern on the chart suggests the move might still have room to run.
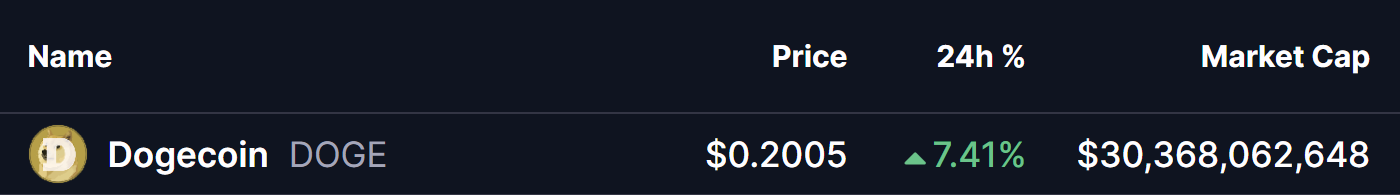 Source: Coinmarketcap
Harmonic Pattern Hints at Potential Upside
On the 4-hour chart, Dogecoin appears to be forming a Bearish Gartley harmonic pattern — a setup that, despite its name, often results in short-term bullish continuation during the formation of its final leg (CD).
The pattern began at Point X near $0.2705, followed by a decline to Point A, a rebound to Point B, and a corrective drop to Point C around $0.1749. After hitting that low, DOGE has shown a strong recovery, now trading near $0.2007 and building momentum for the potential final leg upward.
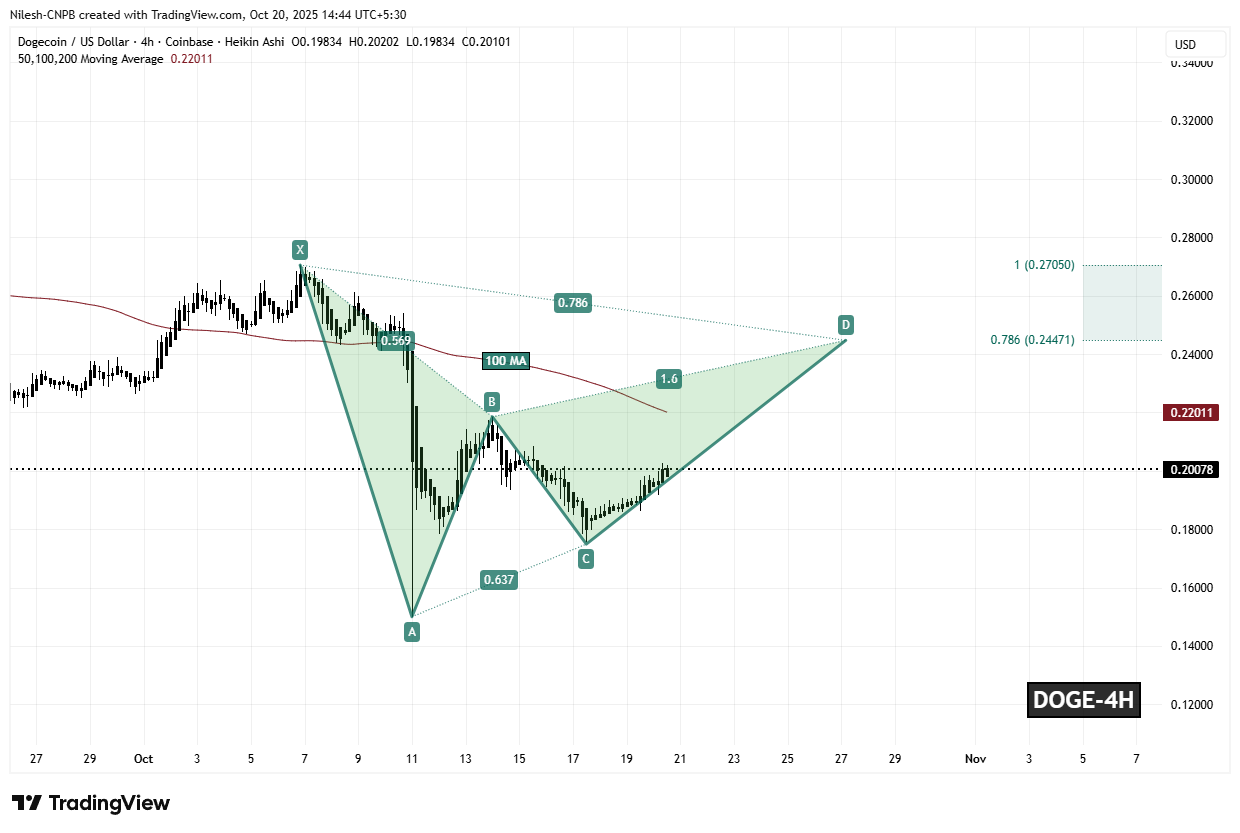 Dogecoin (DOGE) 4H Chart/Coinsprobe (Source: Tradingview)
Importantly, DOGE is hovering just below its 100-hour moving average (MA) at $0.2201, which serves as a critical breakout level. A decisive close above this level could flip it into solid support, signaling the market’s confidence in continuing the bullish leg toward the Potential Reversal Zone (PRZ).
What’s Next for DOGE?
If buyers manage to defend the $0.19 support level and push prices above the 100-hour MA, the Gartley pattern projects an upside move toward the PRZ zone between $0.2447 and $0.2705.
These levels align with the 0.786 and 1.0 Fibonacci extensions — historically key areas where harmonic completions occur and traders often take profit or prepare for reversals.
However, failure to hold above $0.19 could invalidate the pattern, potentially leading to short-term weakness or a deeper correction before the next recovery attempt begins.