Date: Sat, Oct 11, 2025 | 04:20 PM GMT
The cryptocurrency market has witnessed one of the most unforgettable and painful events in the last 24 hours, with a complete bloodbath following the news that President Donald Trump announced a 100% tariff on goods from China — sparking panic across global markets. The move resulted in the largest crypto liquidation in history, with over $19 billion wiped out within a single day.
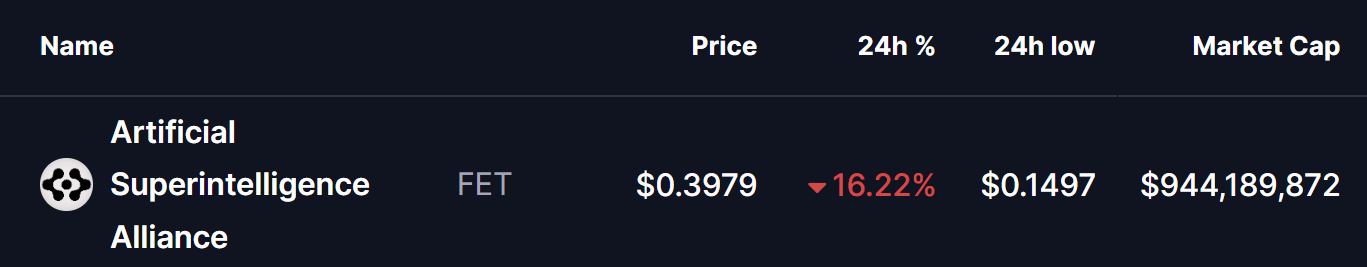
This sudden crash triggered an altcoin massacre, with many tokens dropping over 50% within a minute — and Artificial Superintelligence Alliance (FET) was no exception
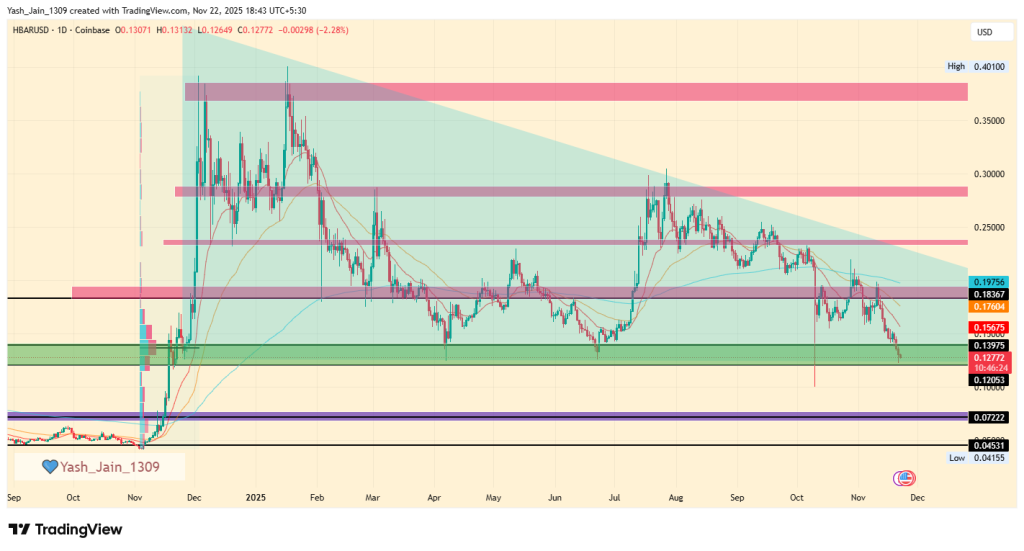
FET crashed to a low of $0.1497, a level not seen since late 2022, before rebounding to around to current level of $0.39. Interestingly, this low also coincides with a critical support level on the chart — a zone that could play a major role in determining FET’s next move.
 Source: Coinmarketcap
Falling Wedge Pattern in Play
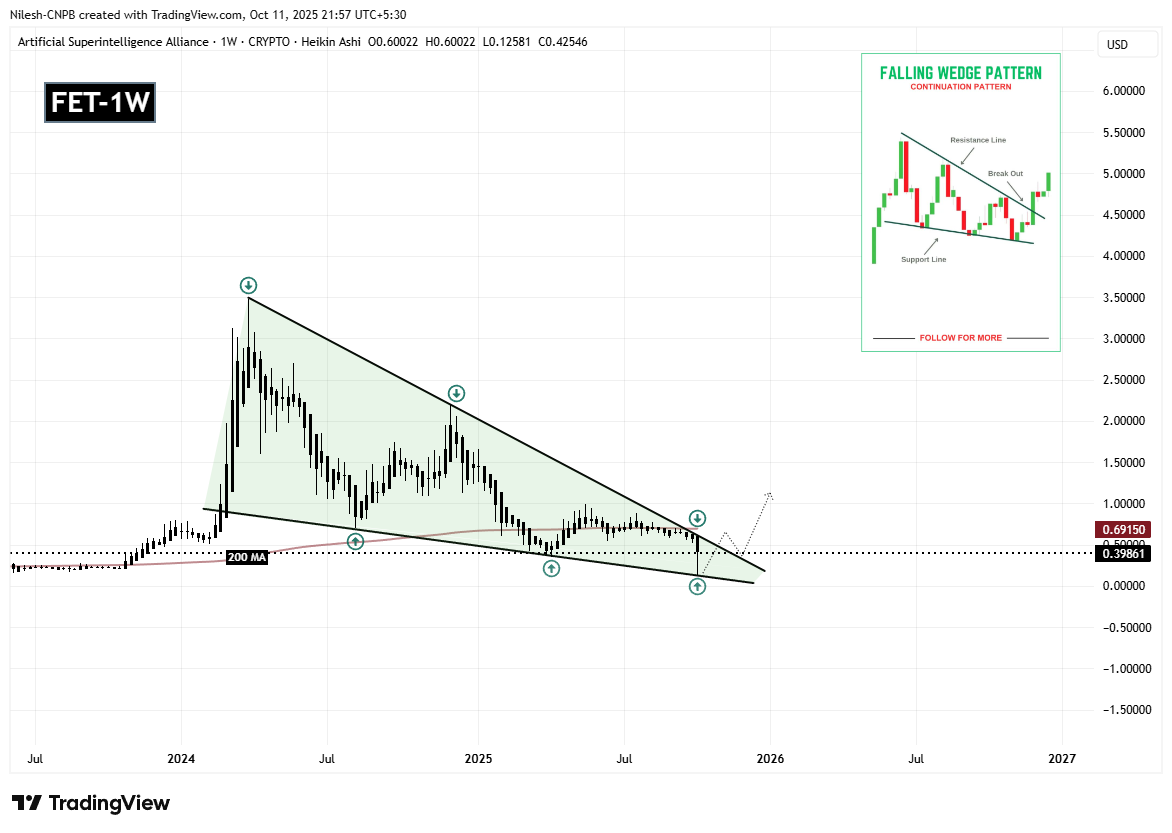
On the weekly chart, FET appears to be forming a falling wedge pattern, a technical formation that often signals selling exhaustion and hints at the potential for a bullish reversal ahead.
The most recent correction drove FET down to the wedge’s lower boundary near $0.1258, which has so far acted as a strong base for buyers to step in. From there, the token has managed to bounce toward $0.3986, though bearish pressure still lingers.
 FET Weekly Chart/Coinsprobe (Source: Tradingview)
If this pattern continues to hold, it could mark the early stages of a potential trend reversal for FET — one that might unfold gradually in the coming weeks.
What’s Next for FET?
FET is now showing early signs of a bullish reversal setup, but before making a clear breakout attempt, the token might spend some time consolidating within its current narrow range.
If buyers step in with renewed momentum at this level, a rebound from the wedge’s lower boundary could trigger a bullish breakout above the upper resistance trendline. Such a move could propel FET toward the 200-day moving average (MA) at $0.6915 — a crucial technical level.
A successful breakout and sustained move above this MA would be the final confirmation that FET has regained bullish momentum after the recent market chaos.