Solana Price Pullback Could Halt at $224 as Bullish Pattern Hints at New Highs

Solana’s short-term pullback may not be a setback. Despite mild selling pressure, on-chain metrics and chart signals suggest $224 could act as a strong floor before a potential breakout toward a new cycle high.
Solana’s latest pullback may not be what it seems. Despite a brief Solana price cooldown (0.6% day-on-day), the network’s on-chain and chart structure suggest that the pause could simply be a reset before the next major leg up.
At around $234, Solana is still up nearly 12% in the past week and 16% over the month, showing that momentum hasn’t faded, only softened. With short-term selling pressure meeting steady accumulation, $224 could be the zone where the current correction finds its floor before pushing forth for a new all-time high.
Short-Term Selling Meets Steady Holder Accumulation
Some profit booking has returned. Solana’s exchange net position change, which tracks the difference between coins entering and leaving centralized exchanges, flipped from –2.01 million SOL on October 3 to +1.82 million SOL on October 5.
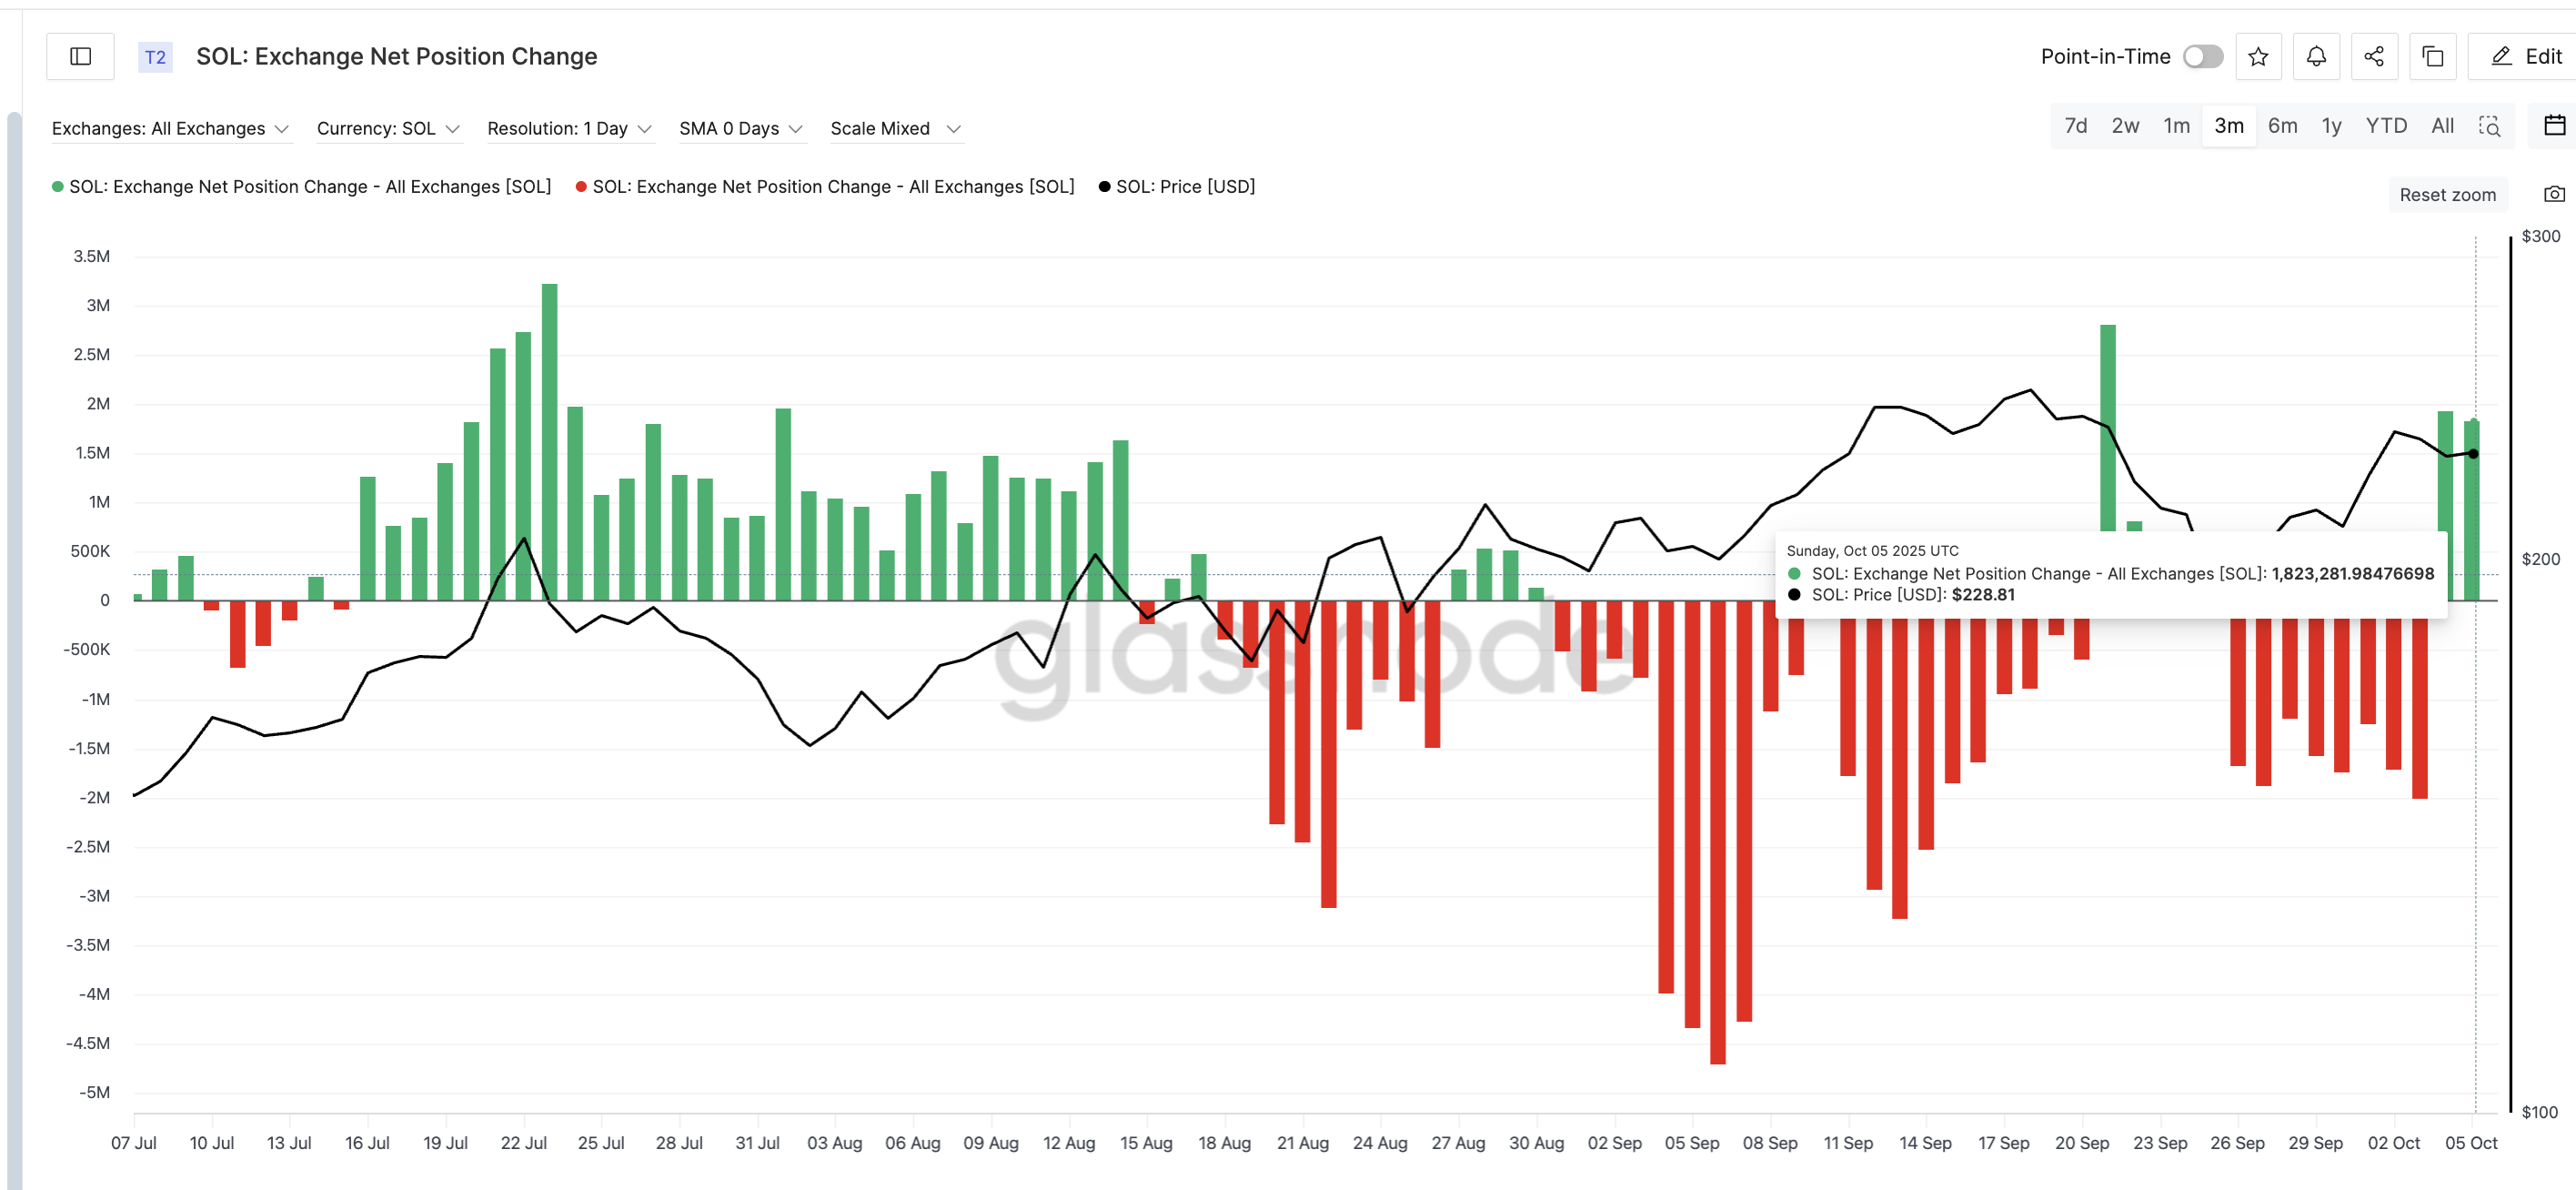 Solana Selling Pressure Increases:
Glassnode
Solana Selling Pressure Increases:
Glassnode
A positive reading means more tokens are being sent to exchanges, usually a sign that traders are preparing to sell.
Want more token insights like this? Sign up for Editor Harsh Notariya’s Daily Crypto Newsletter.
But this pressure is being balanced by mid-term holder conviction. Data from Glassnode’s HODL Waves, which show how long coins stay unmoved, highlight renewed accumulation among short- and mid-term holders.
- 1-week to 1-month holders: up from 9.55% to 13.2% of supply
- 1-month to 3-month holders: up from 12.6% to 14.65%
- 3-month to 6-month holders: up from 11.82% to 12.29%
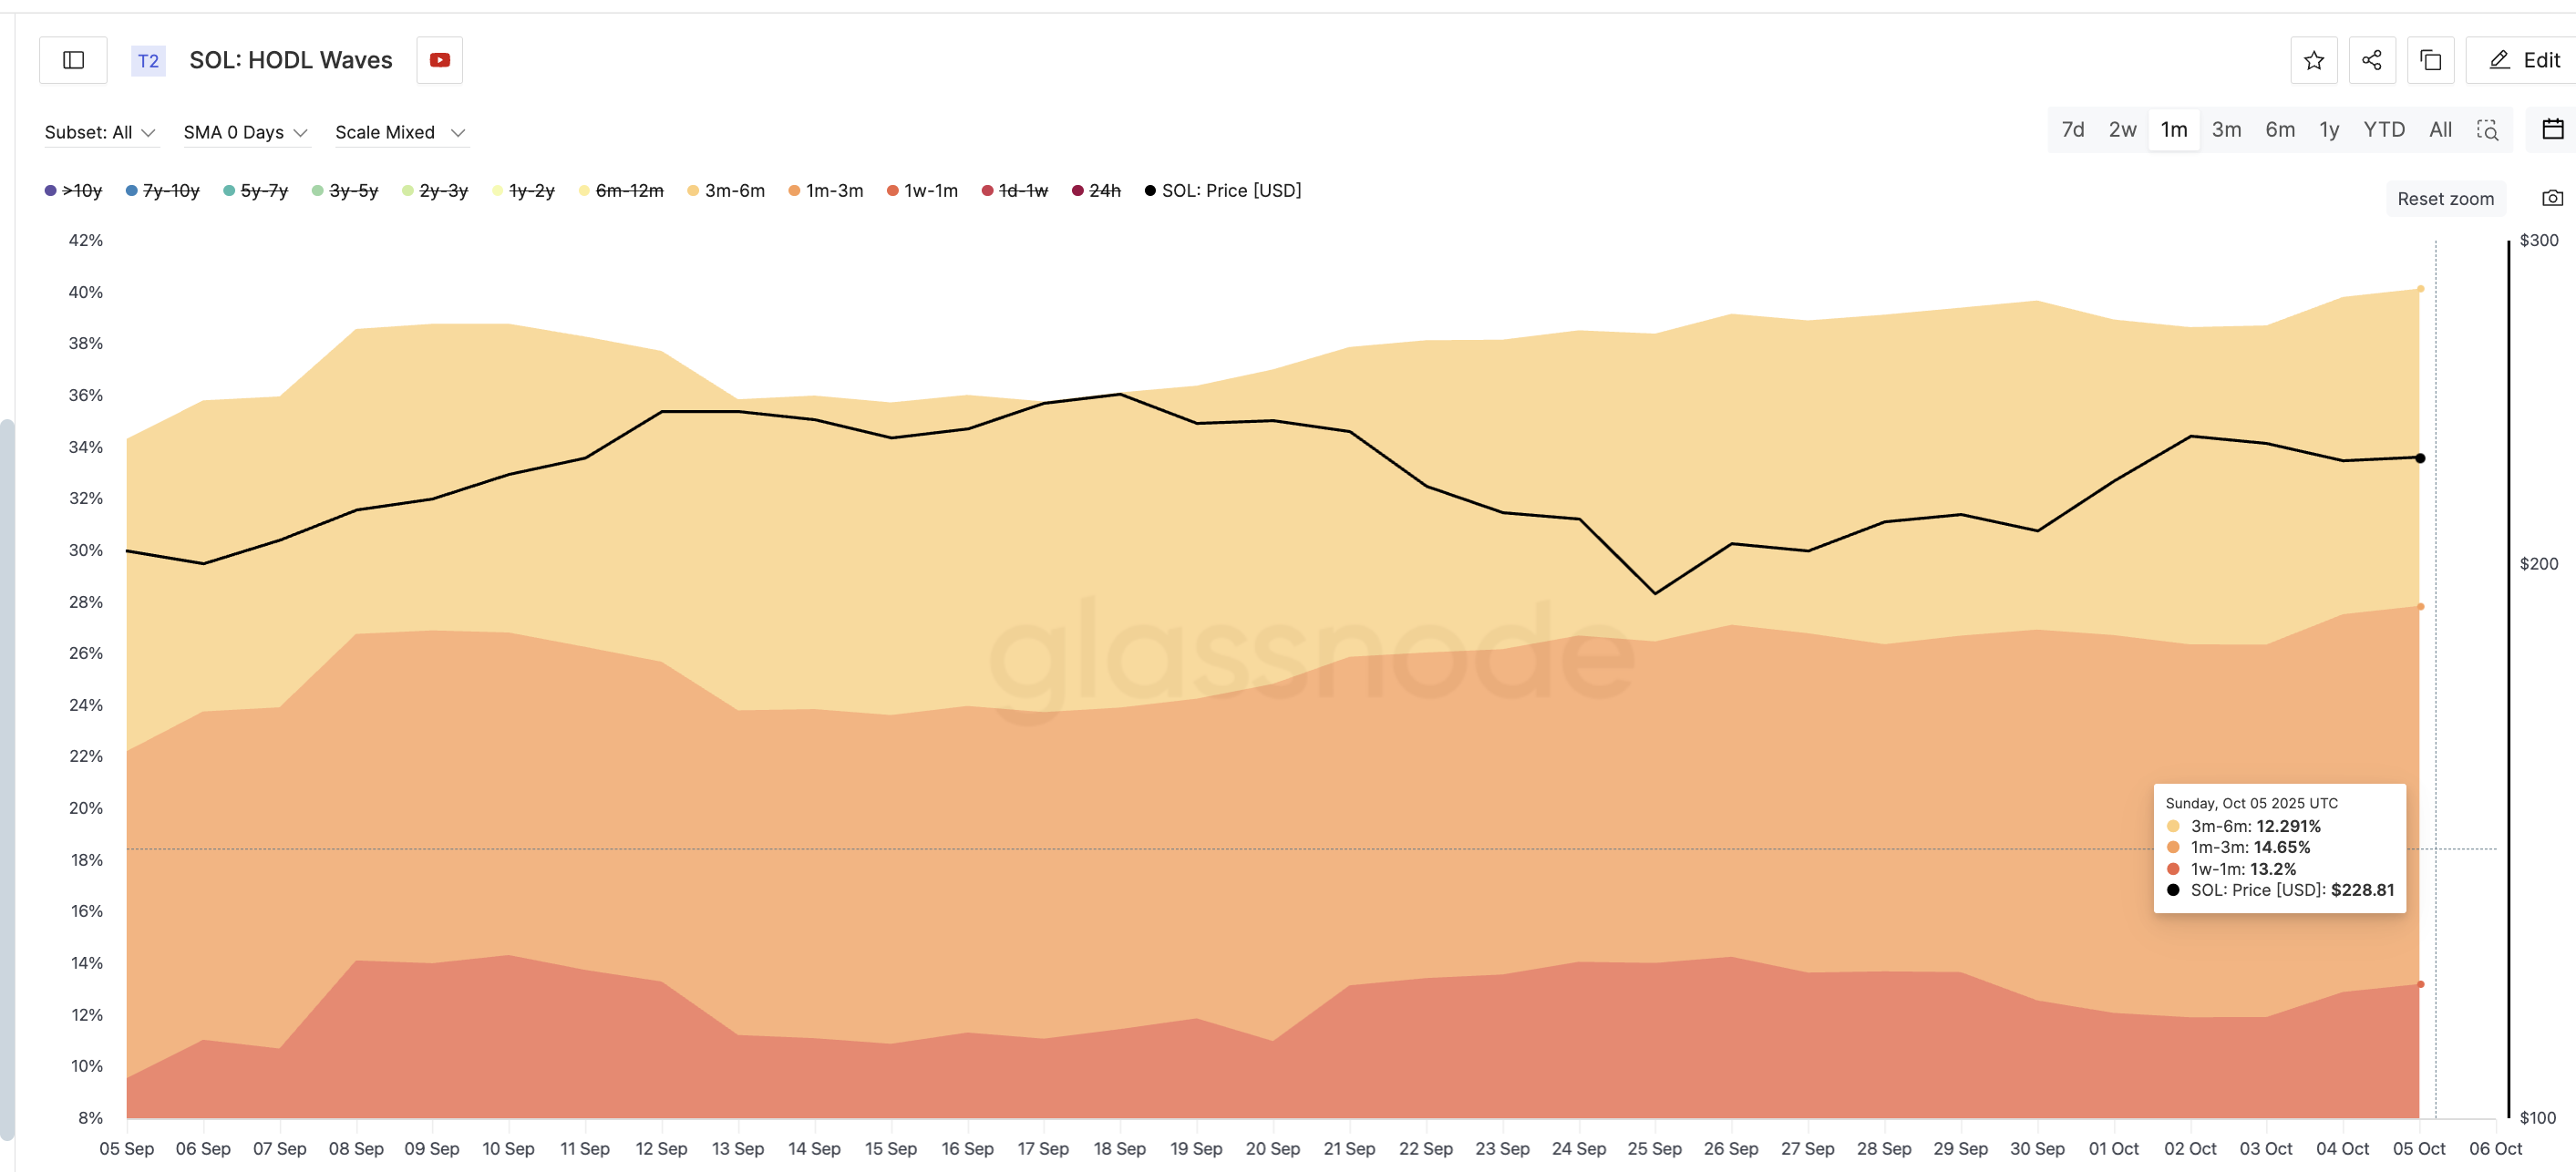 Solana Buyers Are Still Active:
Glassnode
Solana Buyers Are Still Active:
Glassnode
In simple terms, while some Solana traders are booking profits, smaller and mid-term wallets are quietly adding. This mix of selling and buying often marks a “healthy correction” rather than the start of a trend reversal. To know the correction floor, though, you would need to read through the next section.
Solana Price Breakout Setup Targets $279 and Beyond
On the daily chart, Solana trades within an ascending channel, a pattern characterized by gradually forming higher highs and higher lows. Inside the channel, there is a key Solana price level of $224, which has repeatedly cushioned pullbacks.
The latest dip, if it happens more aggressively, could most likely halt around this point, as despite the supposed selling pressure on exchanges, several cohorts are adding to their SOL stash.
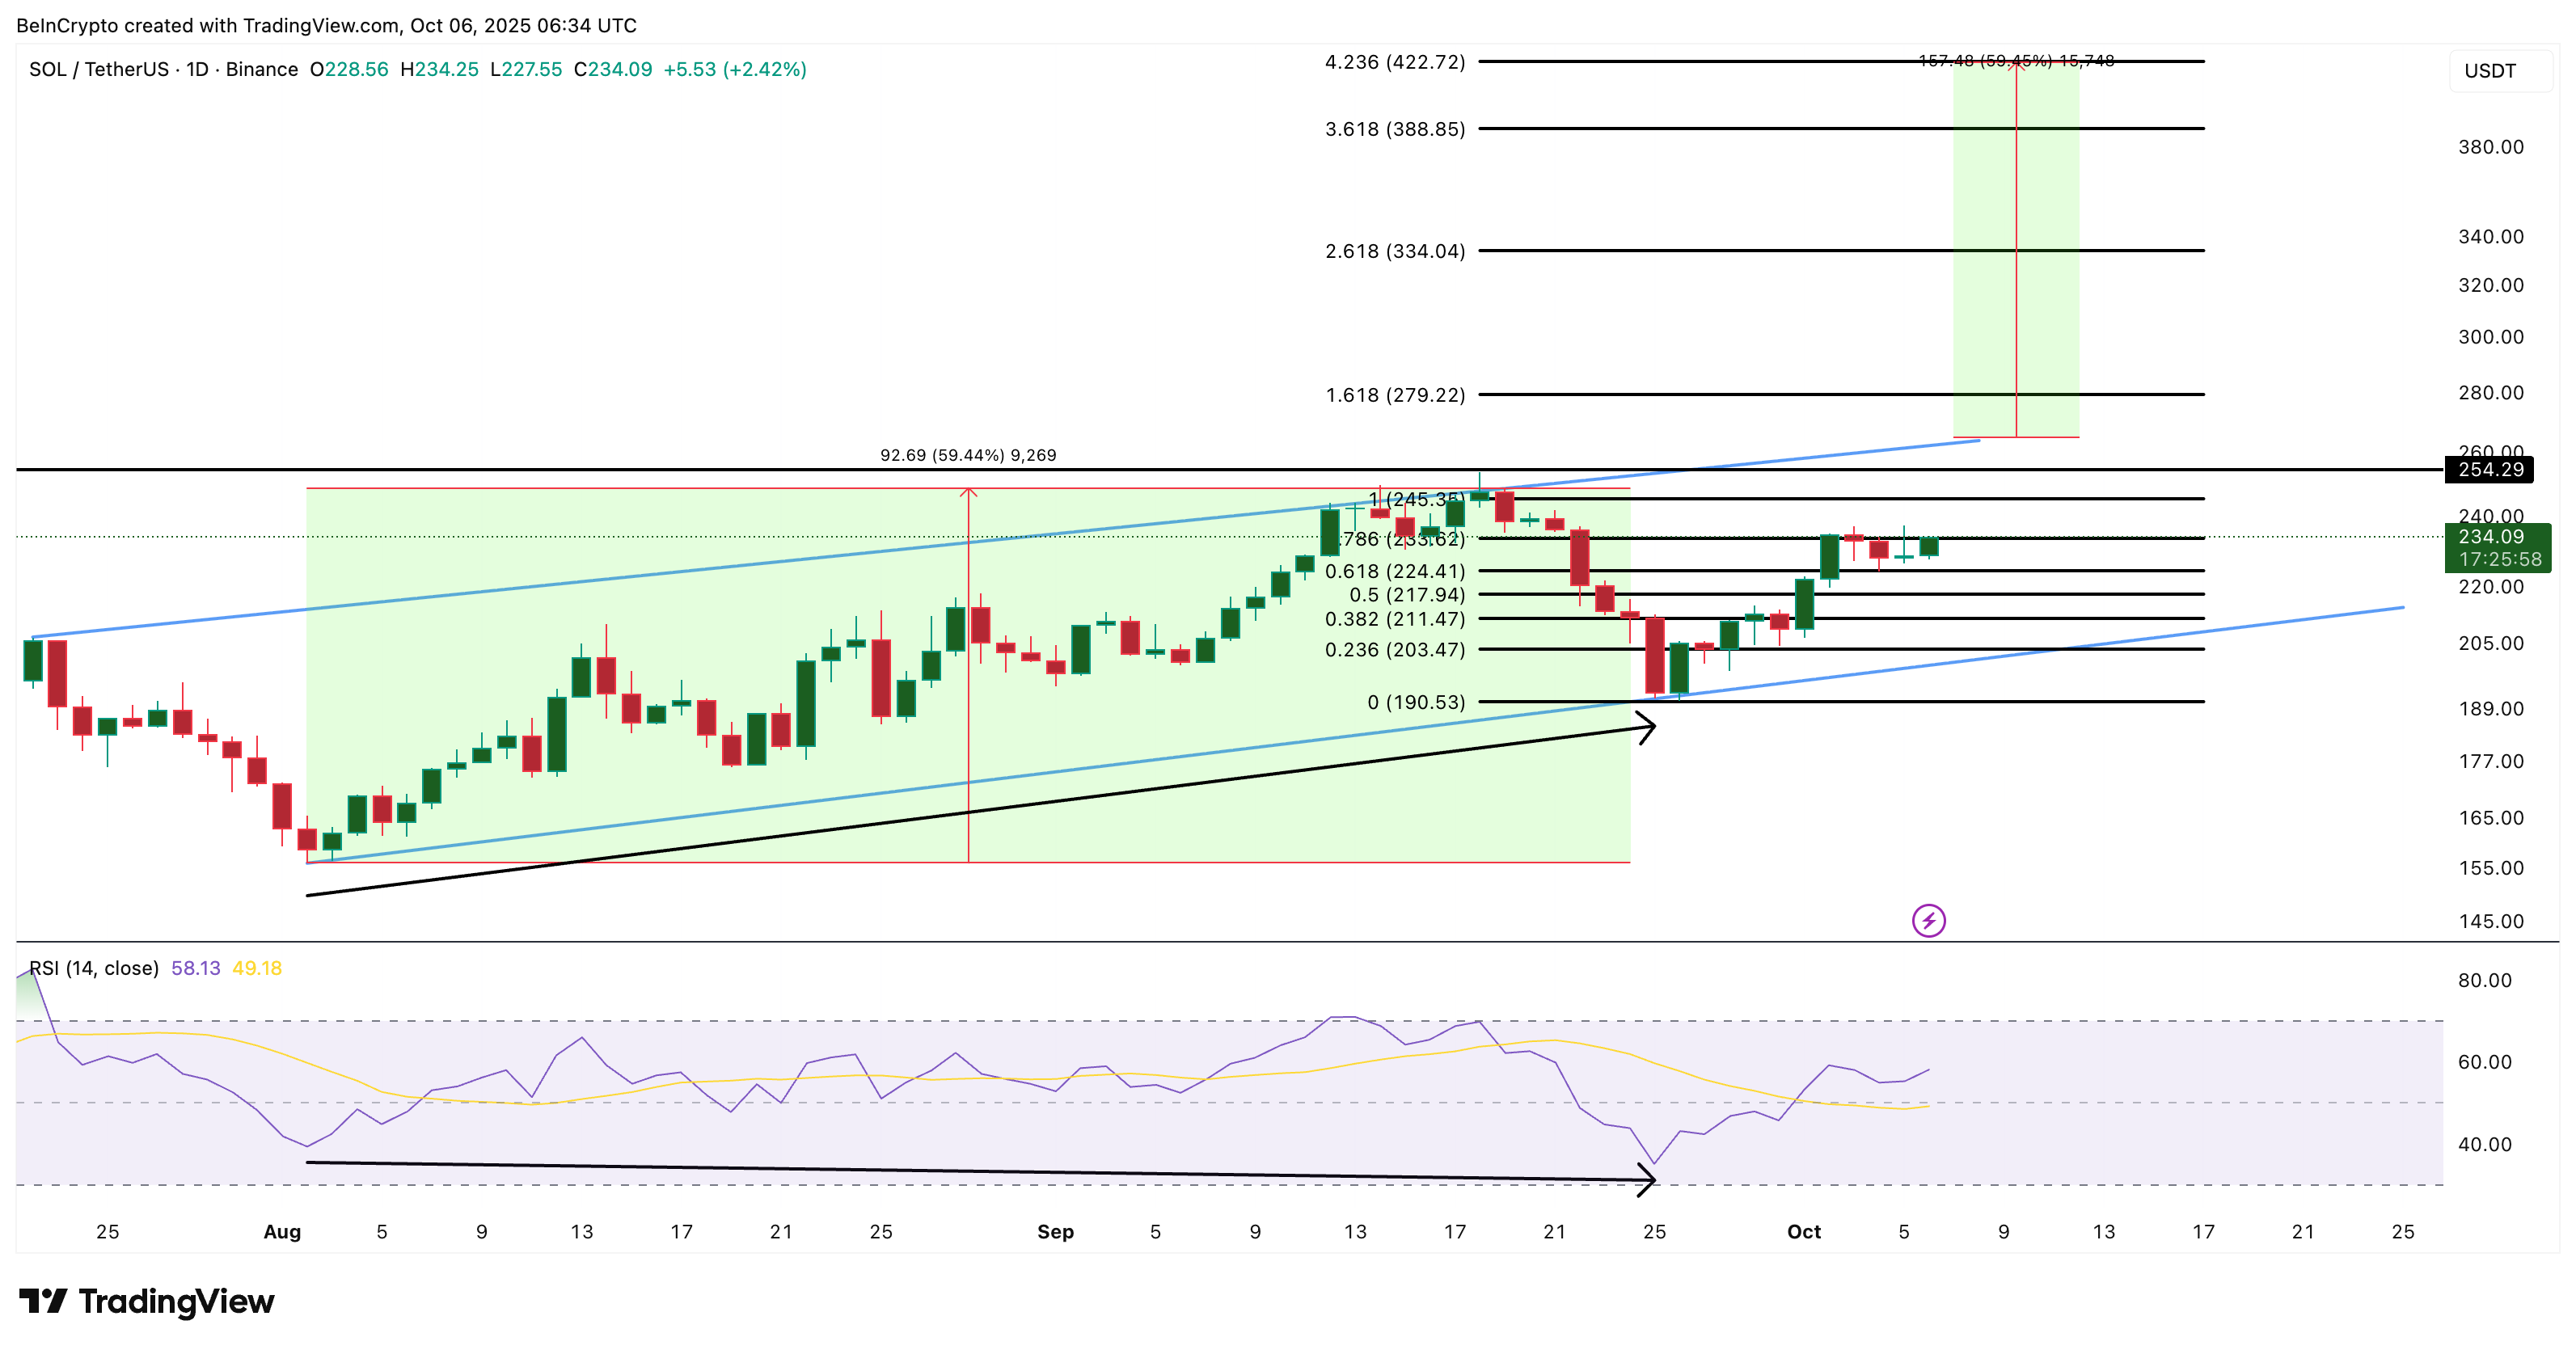 Solana Price Analysis:
TradingView
Solana Price Analysis:
TradingView
Meanwhile, the Relative Strength Index (RSI), which measures momentum, shows a hidden bullish divergence. Between August and late September, the Solana price made a higher low while the RSI made a lower low. This usually confirms that an uptrend still has strength beneath the surface.
If the Solana price closes a daily candle above $245, it could open the way toward $279, the next major resistance. Based on the channel’s height, the potential breakout target from the upper trendline of the channel roughly aligns near $422 — a possible new cycle high if momentum sustains.
For now, the pullback looks less like weakness and more like a deep breath before Solana’s next move higher. Yet, a dip under $190 would invalidate the bullish outlook for now.
Disclaimer: The content of this article solely reflects the author's opinion and does not represent the platform in any capacity. This article is not intended to serve as a reference for making investment decisions.
You may also like
EUR/USD Price Forecast: Consolidates below mid-1.1700s as Iran risks, Fed bets support USD
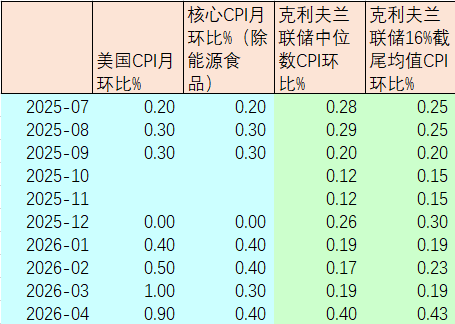
US April CPI Year-on-Year at 3.8%, No Need for Panic at All
US Dollar Index remains flat after Trump’s recent Iran threats