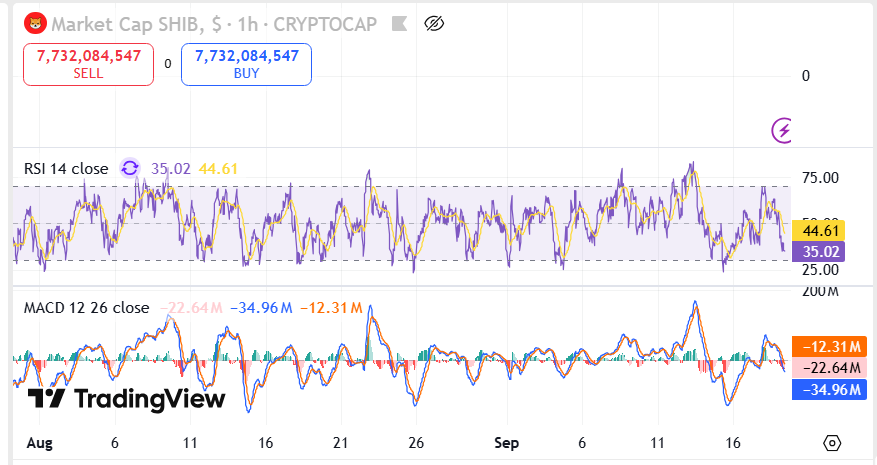
- Shiba Inu’s RSI at 46.10 shows neutral momentum, keeping the token between oversold and overbought levels.
- The MACD histogram at -6.65M highlights slowing bearish pressure, with a narrowing gap between MACD and signal lines.
- A strong support zone continues to anchor SHIB’s price action, drawing traders focus on potential rebound moves.
The market activity of Shiba Inu is gaining fresh momentum with the token consolidating around an important support line. New chart patterns indicate that traders are keen on whether the asset will be able to hold its position in this zone.
The technical indicators such as RSI and MACD give a better picture of the momentum, as market participants consider the option of a rebound of the existing ranges. The market capitalization of 7.73 billion underlines the amount of capital currently held in the asset.
Technical Indicators Signal Neutral Momentum
The Relative Strength Index (RSI) currently registers at 46.10, with a previous low near 35.38. This positioning keeps the asset inside neutral territory, neither strongly oversold nor overbought. Such mid-level RSI readings often precede direction-setting moves, and traders remain alert to possible shifts.
 Source: TradingView
The Moving Average Convergence Divergence (MACD) offers additional context. At present, the MACD line stands at -23.22 million, while the signal line is positioned at -29.87 million. The histogram shows -6.65 million, marking reduced negative momentum compared with earlier declines. This narrowing gap highlights slowing downward pressure, although confirmation of trend change remains pending.
Support Zone Draws Close Attention
A key support zone on the four-hour chart has emerged between recent trading ranges . This zone has repeatedly provided a base during previous pullbacks. Notably, the highlighted area suggests that buyers continue to defend this range against deeper retracements.
Market observers note that the outlined zone has helped stabilize prior declines. Consequently, many are focusing on whether the token will sustain strength at these levels. A strong defense of this support could maintain Shiba Inu within its broader consolidation structure, ensuring continued participation from active traders.
Market Implications and Potential Price Path
Shiba Inu’s capitalization remains balanced, with reported buy and sell values each holding at $7.735 billion. This equilibrium reflects steady liquidity across exchanges. The one-hour timeframe shows RSI stability and narrowing MACD levels, both of which support the focus on the current consolidation phase.
The latest projection chart outlines a potential rebound from the support region. If this bounce occurs, the path sketched indicates an upward drive toward higher ranges. Such mapping underscores the importance of present trading behavior around the identified zone.
Together, these observations point to a market where traders remain attentive to technical thresholds. The indicators highlight stable conditions, and the support zone continues to guide expectations. The coming sessions will determine whether consolidation persists or whether a breakout structure begins to emerge.