Solana Faces Resistance Near $171 as Indicators Reflect Weakening Momentum

- SOL faces rejection near $171, fails to break key resistance, and falls back to $163.
- RSI at 44.72 and MACD crossover confirm weakening momentum and bearish divergence.
- Trading volume up 23.37%, but price remains under pressure near interim support at $160.
Solana (SOL) is showing signs of declining bullish strength, following an intraday pullback near $171 and a continued failure to break long-standing resistance levels. As of press time, SOL was trading at $163.98, marking a 3.29% drop in the past 24 hours. Despite a gain of over $171 during the session, the asset reversed due to increased trading activity, returning to its earlier range.
Chart data from early 2024 through August 2025 shows a continuing horizontal trading range for SOL. The token has repeatedly encountered resistance between $210 and $220, while support has held around the $130 level. A temporary breakout above $300 occurred in December 2024, but the price quickly retraced, reversing the move and reentering the range.
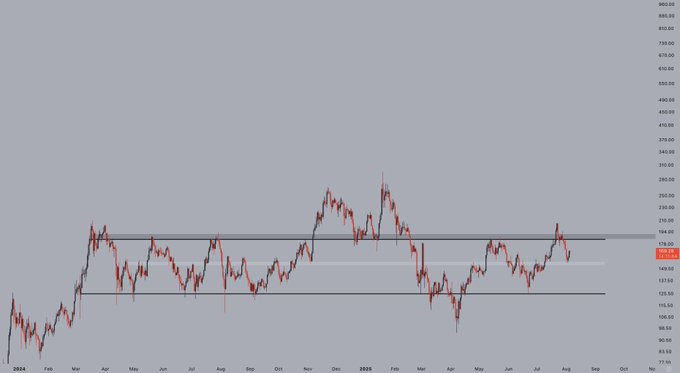
In early 2025, SOL dropped toward the $115–$130 support zone before rebounding in March. Attempts to climb back toward resistance continued through June and July but again failed to breach the $210 mark. The recent decline has returned the token to an interim support area between $160 and $170.
Intraday Spike Rejected Despite Volume Surge
SOL traded above $171 on August 5 following a rally that began the previous evening. The move peaked midday, but strong bearish pressure during the U.S. trading session led to a reversal. CoinMarketCap data shows the price fell back to $164.32 by press time, reflecting a 1.14% intraday decline.
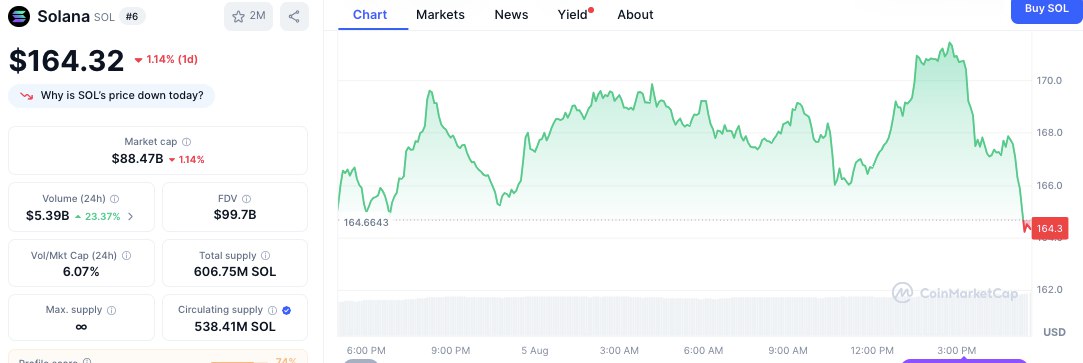
Despite the price drop, trading volume rose. The 24-hour volume climbed 23.37% to $5.39 billion. Solana’s market capitalization currently stands at $88.47 billion, with a total supply of 606.75 million tokens and a circulating supply of 538.41 million. The platform’s Fully Diluted Valuation (FDV) is recorded at $99.78 billion.
RSI and MACD Show Bearish Divergence
Leading technical indicators continue to signal caution. The Relative Strength Index (RSI) has dropped to 44.72, falling below the neutral midpoint of 50. This decline follows a recent peak of around 75 in mid-July, which marked an overbought condition before the latest pullback began.
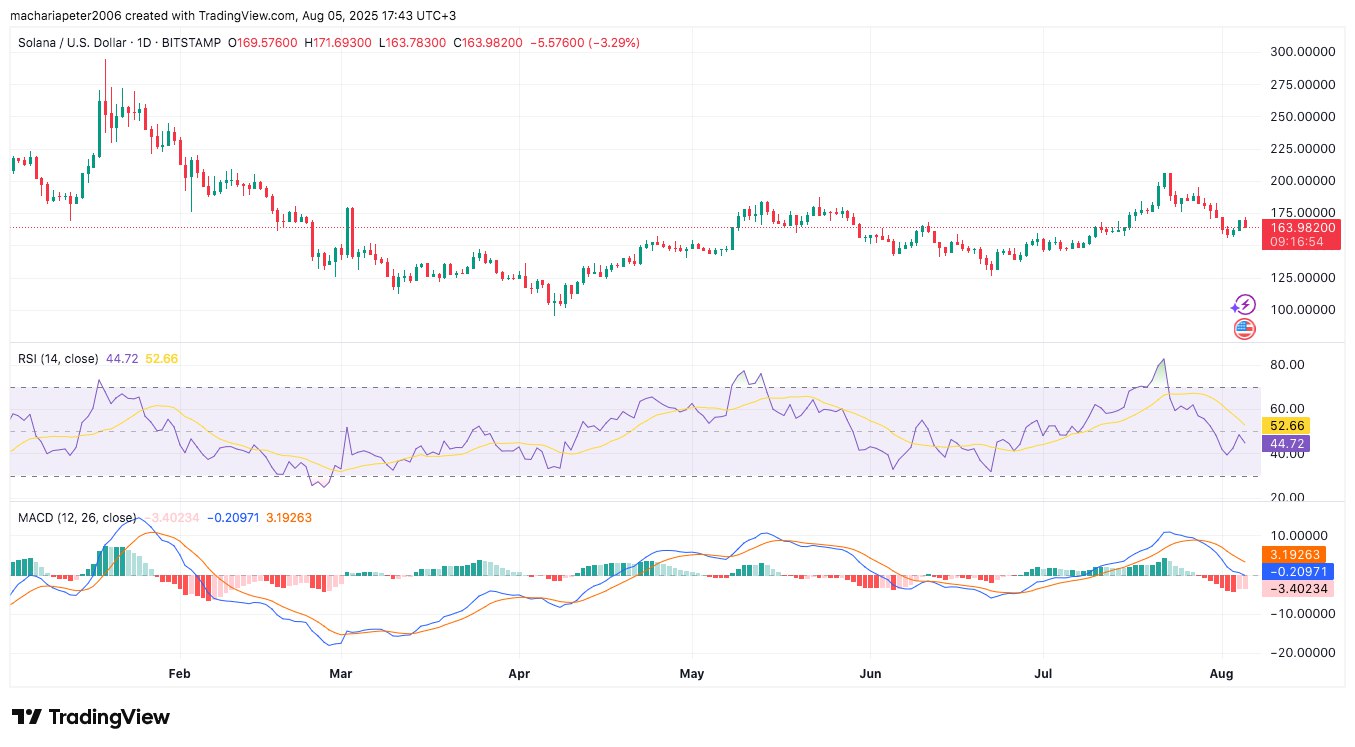
Meanwhile, the Moving Average Convergence Divergence (MACD) also signals bearish momentum. The MACD line is at -0.20971, while the signal line stands at 3.19263, forming a negative crossover. The histogram has turned negative, measured at -3.40234, indicating growing downside momentum.
Until the RSI passes over the 50 mark and the MACD histogram starts to transition to green, SOL could experience more downward pressure. Any decline below $160 would open the token to a bearish support at around $150 and any upward progress would demand a strict retest and sustain above $170.
Disclaimer: The content of this article solely reflects the author's opinion and does not represent the platform in any capacity. This article is not intended to serve as a reference for making investment decisions.
You may also like
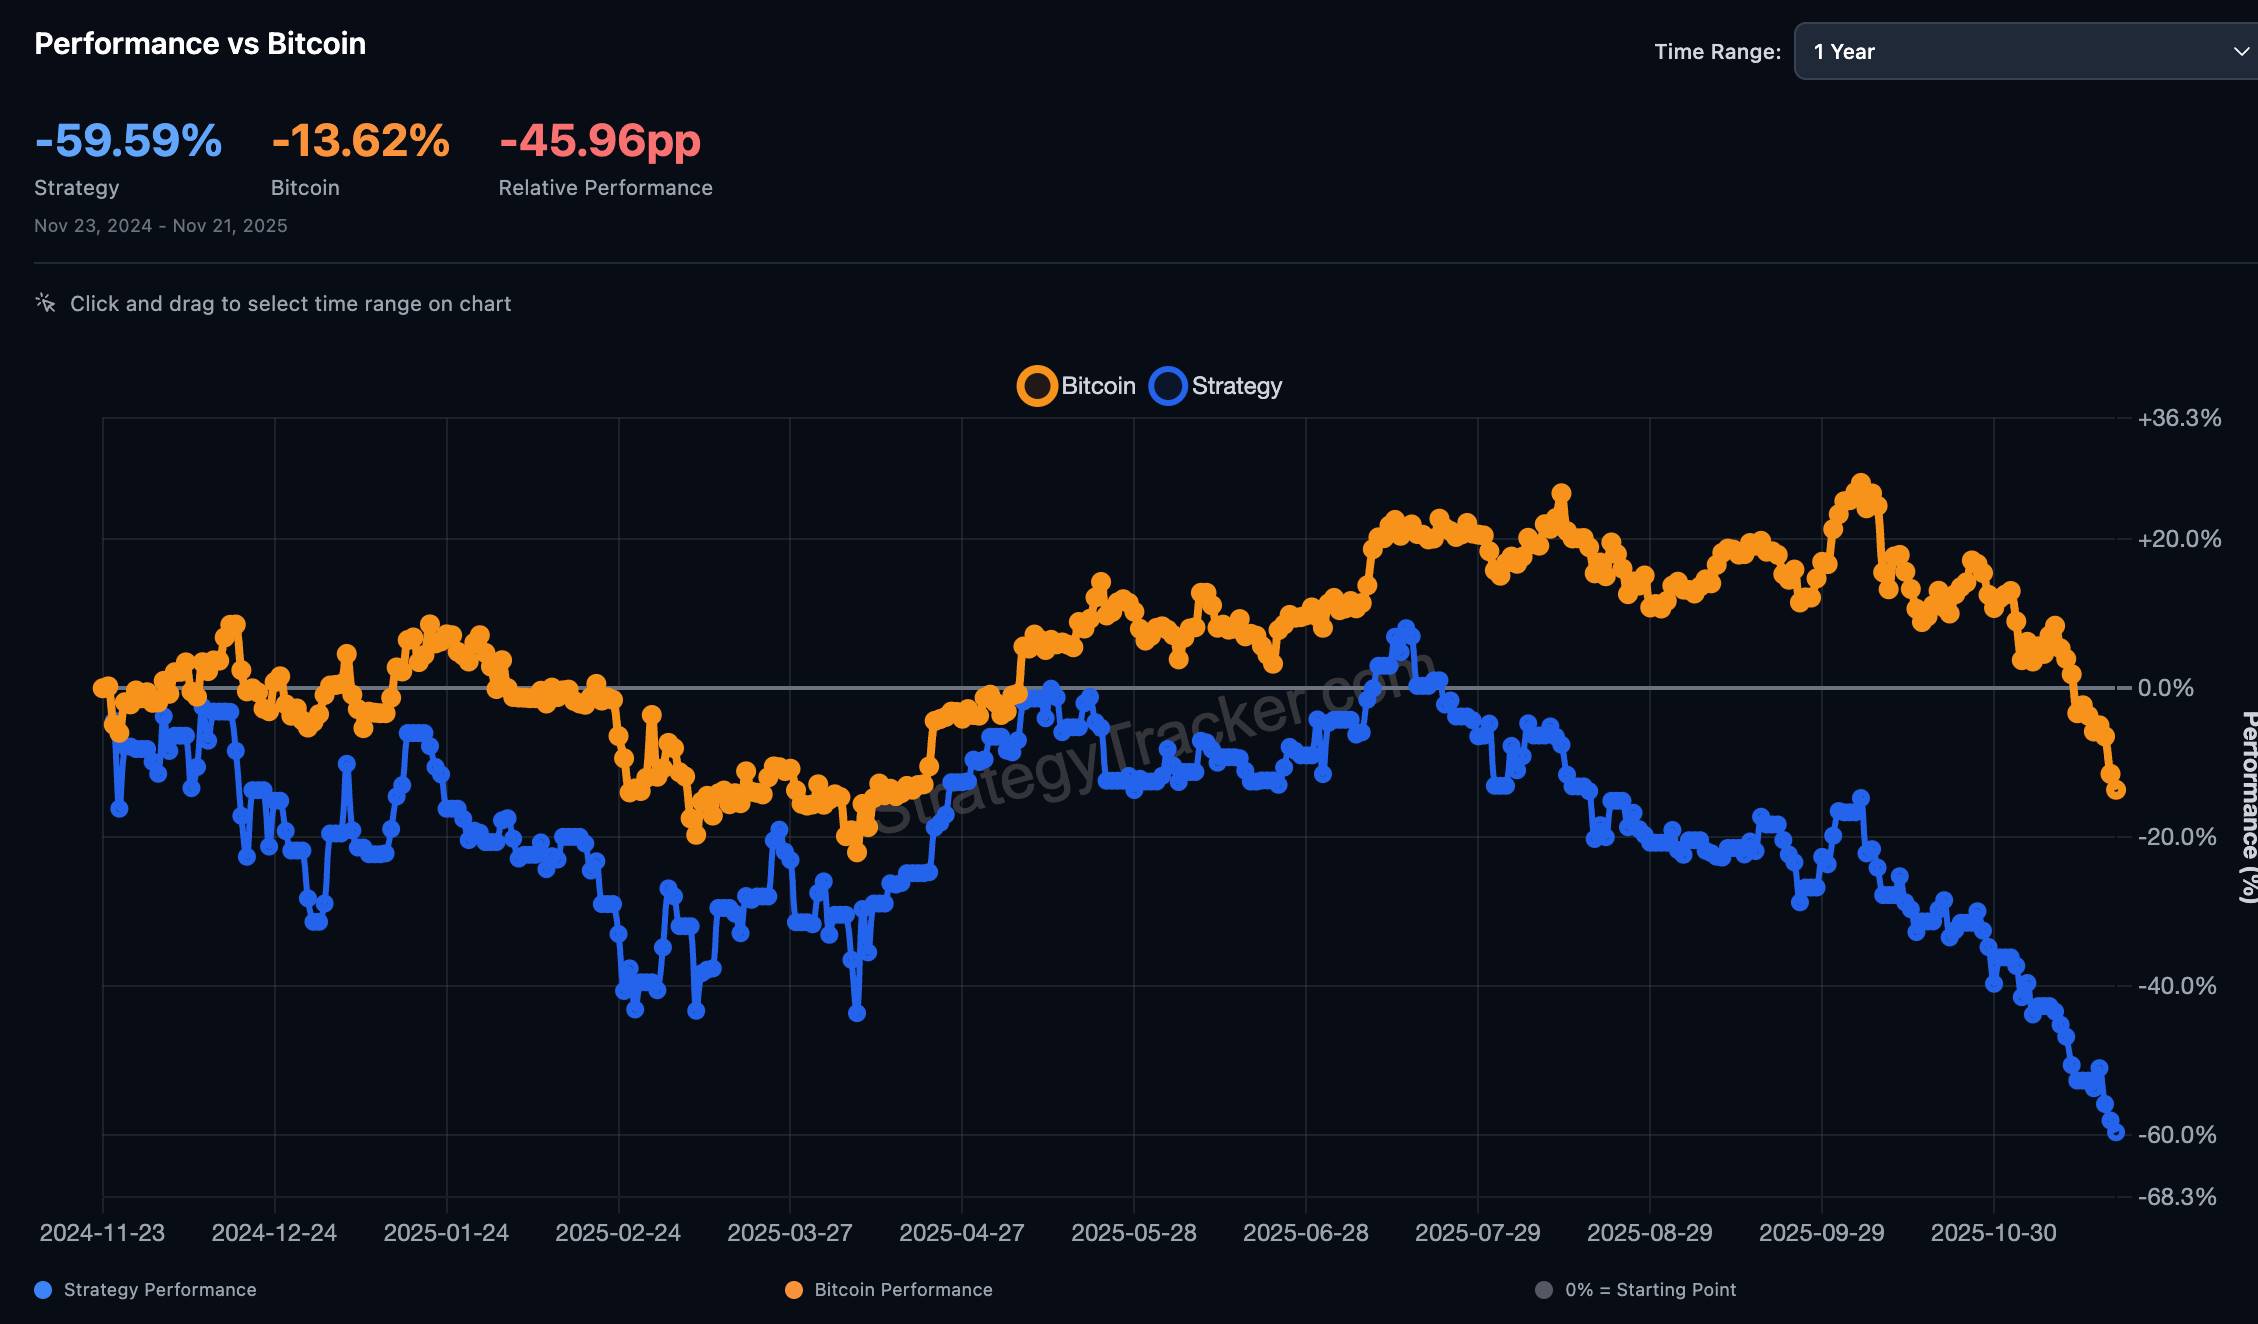
$8.8 billion outflow countdown: MSTR is becoming the abandoned child of global index funds
The final result will be revealed on January 15, 2026, and the market has already started to vote with its feet.
Deconstructing DAT: Beyond mNAV, How to Identify "Real vs. Fake HODLing"?
There is only one iron rule for investing in DAT: ignore premium bubbles and only invest in those with a genuine flywheel of continuously increasing "crypto per share."

Empowered by AI Avatars, How Does TwinX Create Immersive Interaction and a Value Closed Loop?
1. **Challenges in the Creator Economy**: Web2 content platforms suffer from issues such as opaque algorithms, non-transparent distribution, unclear commission rates, and high costs for fan migration, making it difficult for creators to control their own data and earnings. 2. **Integration of AI and Web3**: The development of AI technology, especially AI Avatar technology, combined with Web3's exploration of the creator economy, offers new solutions aimed at breaking the control of centralized platforms and reconstructing content production and value distribution. 3. **Positioning of the TwinX Platform**: TwinX is an AI-driven Web3 short video social platform that aims to reconstruct content, interaction, and value distribution through AI avatars, immersive interactions, and a decentralized value system, enabling creators to own their data and income. 4. **Core Features of TwinX**: These include AI avatar technology, which allows creators to generate a learnable, configurable, and sustainably operable "second persona", as well as a closed-loop commercialization pathway that integrates content creation, interaction, and monetization. 5. **Web3 Characteristics**: TwinX embodies the assetization and co-governance features of Web3. It utilizes blockchain to confirm and record interactive behaviors, turning user activities into traceable assets, and enables participants to engage in platform governance through tokens, thus integrating the creator economy with community governance.
Aster CEO explains in detail the vision of Aster privacy L1 chain, reshaping the decentralized trading experience
Aster is set to launch a privacy-focused Layer 1 (L1) public chain, along with detailed plans for token empowerment, global market expansion, and liquidity strategies.