Bitget App
Trade smarter
Buy cryptoMarketsTradeFuturesEarnSquareMore
FET Testing Key Support – Could This Pattern Prevent Further Decline?

FET Testing Key Support – Could This Pattern Prevent Further Decline?

CoinsProbeCoinsProbe2025/08/01 08:00
By:Nilesh Hembade

Date: Fri, Aug 01, 2025 | 06:10 AM GMT

The broader cryptocurrency market is facing a notable pullback, triggered largely by Ethereum (ETH) failing to sustain its momentum after testing a key multi-year resistance around $3,940. ETH has since dropped to around $3,675, down 4% on the day, and this weakness has spilled over into altcoins — including Artificial Superintelligence Alliance (FET).

FET has taken a hit of over 5% in the last 24 hours, deepening its weekly loss to around 8%. But more importantly, the token has now arrived at a pivotal technical level — one that could decide whether this is just a temporary dip or the start of a larger correction.

FET Testing Key Support – Could This Pattern Prevent Further Decline? image 0 
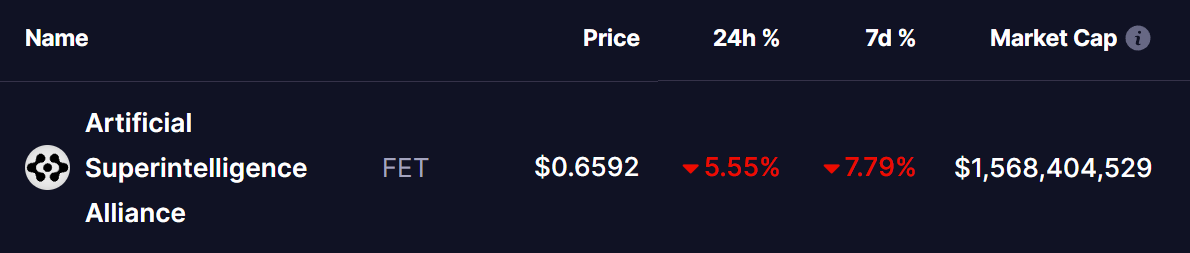
Source: Coinmarketcap

Testing Support of Symmetrical Expanding Triangle Pattern

On the daily chart, FET is trading within a symmetrical triangle pattern, which is typically a neutral formation — meaning it can resolve either to the upside or downside depending on the breakout direction. The price has now reached the lower boundary of this triangle, around the $0.65 level.

FET Testing Key Support – Could This Pattern Prevent Further Decline? image 1 
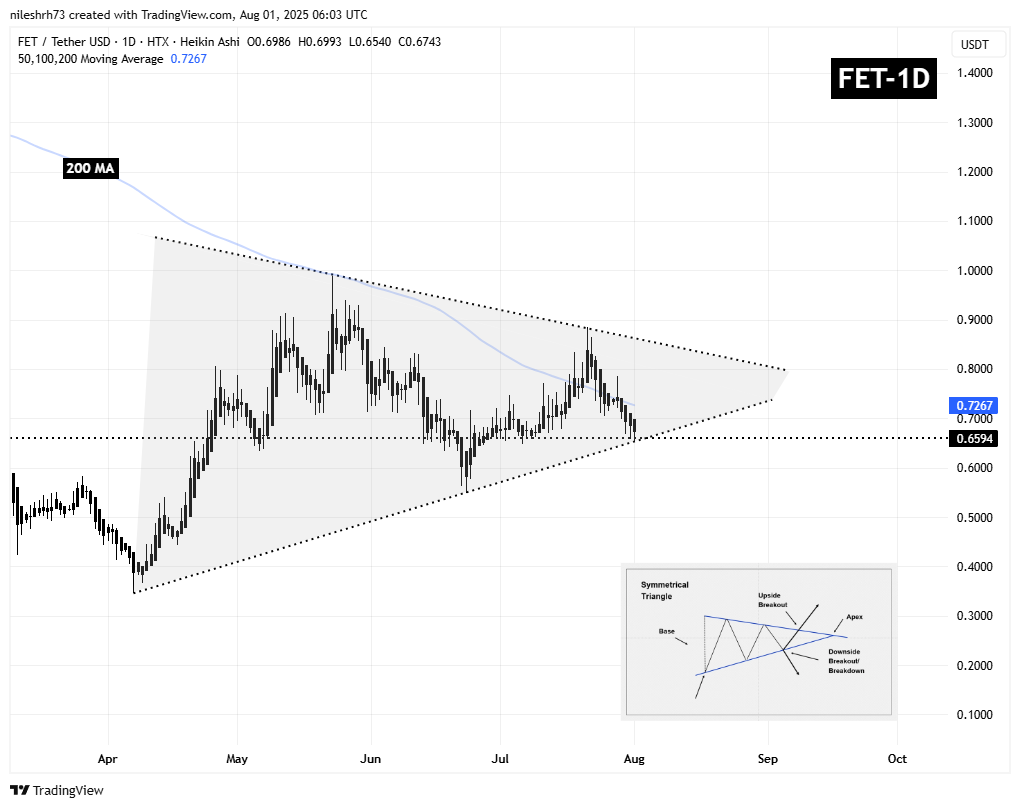
FET Daily Chart/Coinsprobe (Source: Tradingview)

This lower trendline has acted as dynamic support for several months, and its significance is amplified by the recent breakdown below the 200-day moving average, currently sitting at approximately $0.72.

What Next for FET?

If FET manages to hold the $0.65 support and initiates a bounce, it could reclaim the 200-day moving average — a key technical trigger that might attract bullish momentum. A successful move above this level could set the stage for a push toward the triangle’s upper resistance near $0.80, or even higher if broader market sentiment improves.

On the flip side, failure to hold this lower trendline support could result in a bearish breakdown. If that happens, FET could tumble toward the next support zone around $0.55 or even revisit earlier lows — a move that might trigger panic selling or stop-loss cascades from trader.

With the price sitting at a key inflection point, the next few daily candles will be crucial.

0
0

Disclaimer: The content of this article solely reflects the author's opinion and does not represent the platform in any capacity. This article is not intended to serve as a reference for making investment decisions.

PoolX: Earn new token airdrops
Lock your assets and earn 10%+ APR
Lock now!

You may also like

Five charts to help you understand: Where does the market go after each policy storm?

After this regulatory crackdown, is it a harbinger of an impending downturn, or the beginning of a new cycle where all negative news has been fully priced in? Let’s examine the trajectory after the storm through five key policy milestones.

Biteye2025/12/10 07:33
Five charts to help you understand: Where does the market go after each policy storm?

Mars Morning News | The crypto market rebounds across the board, Bitcoin rises above $94,500; The "CLARITY Act" draft is expected to be released this week

The crypto market has fully rebounded, with bitcoin surpassing $94,500 and US crypto-related stocks rising across the board. The US Congress is advancing the CLARITY Act to regulate cryptocurrencies. The SEC chairman stated that many ICOs are not securities transactions. Whales are holding a large number of profitable ETH long positions. Summary generated by Mars AI. The accuracy and completeness of the content generated by the Mars AI model is still being iteratively updated.

MarsBit2025/12/10 06:35
Mars Morning News | The crypto market rebounds across the board, Bitcoin rises above $94,500; The "CLARITY Act" draft is expected to be released this week

Federal Reserve’s Major Shift: From QT to RMP, How Will the Market Transform by 2026?

The article discusses the background, mechanism, and impact on financial markets of the Federal Reserve's introduction of the Reserve Management Purchases (RMP) strategy after ending Quantitative Tightening (QT) in 2025. RMP is regarded as a technical operation aimed at maintaining liquidity in the financial system, but the market interprets it as a covert easing policy. The article analyzes RMP's potential effects on risk assets, the regulatory framework, and fiscal policy, and provides strategic recommendations for institutional investors. Summary generated by Mars AI This summary was generated by the Mars AI model, and the accuracy and completeness of its content are still in the process of iterative improvement.

MarsBit2025/12/10 06:35
Federal Reserve’s Major Shift: From QT to RMP, How Will the Market Transform by 2026?
© 2025 Bitget