
Hedera (HBAR) Leads Made In USA Coins in Weekly Losses – What’s Next?

HBAR's slight recovery after hitting a 30-day low may be short-lived. Technical indicators point to continued bearish momentum unless buying surges.
A dip in overall crypto trading activity last week sent Hedera’s native token, HBAR, tumbling to a 30-day low of $0.16 on May 31. Although the token has managed to climb around 3% over the past 24 hours, the recovery may not mark a true bullish reversal.
Technical indicators suggest the rebound may be a classic dead cat bounce—a temporary relief in a prevailing downtrend. This analysis explains why this may be the case.
Persistent Selling Pushes HBAR Below Key Technical Level
Hedera dropped over 10% in the past week, facing the worst loss among the top 10 made in USA coins.
HBAR’s steady decline over the past week has pushed the token’s price below its 20-day exponential moving average (EMA). This breakdown confirms the presence of strong selling pressure among spot market participants.
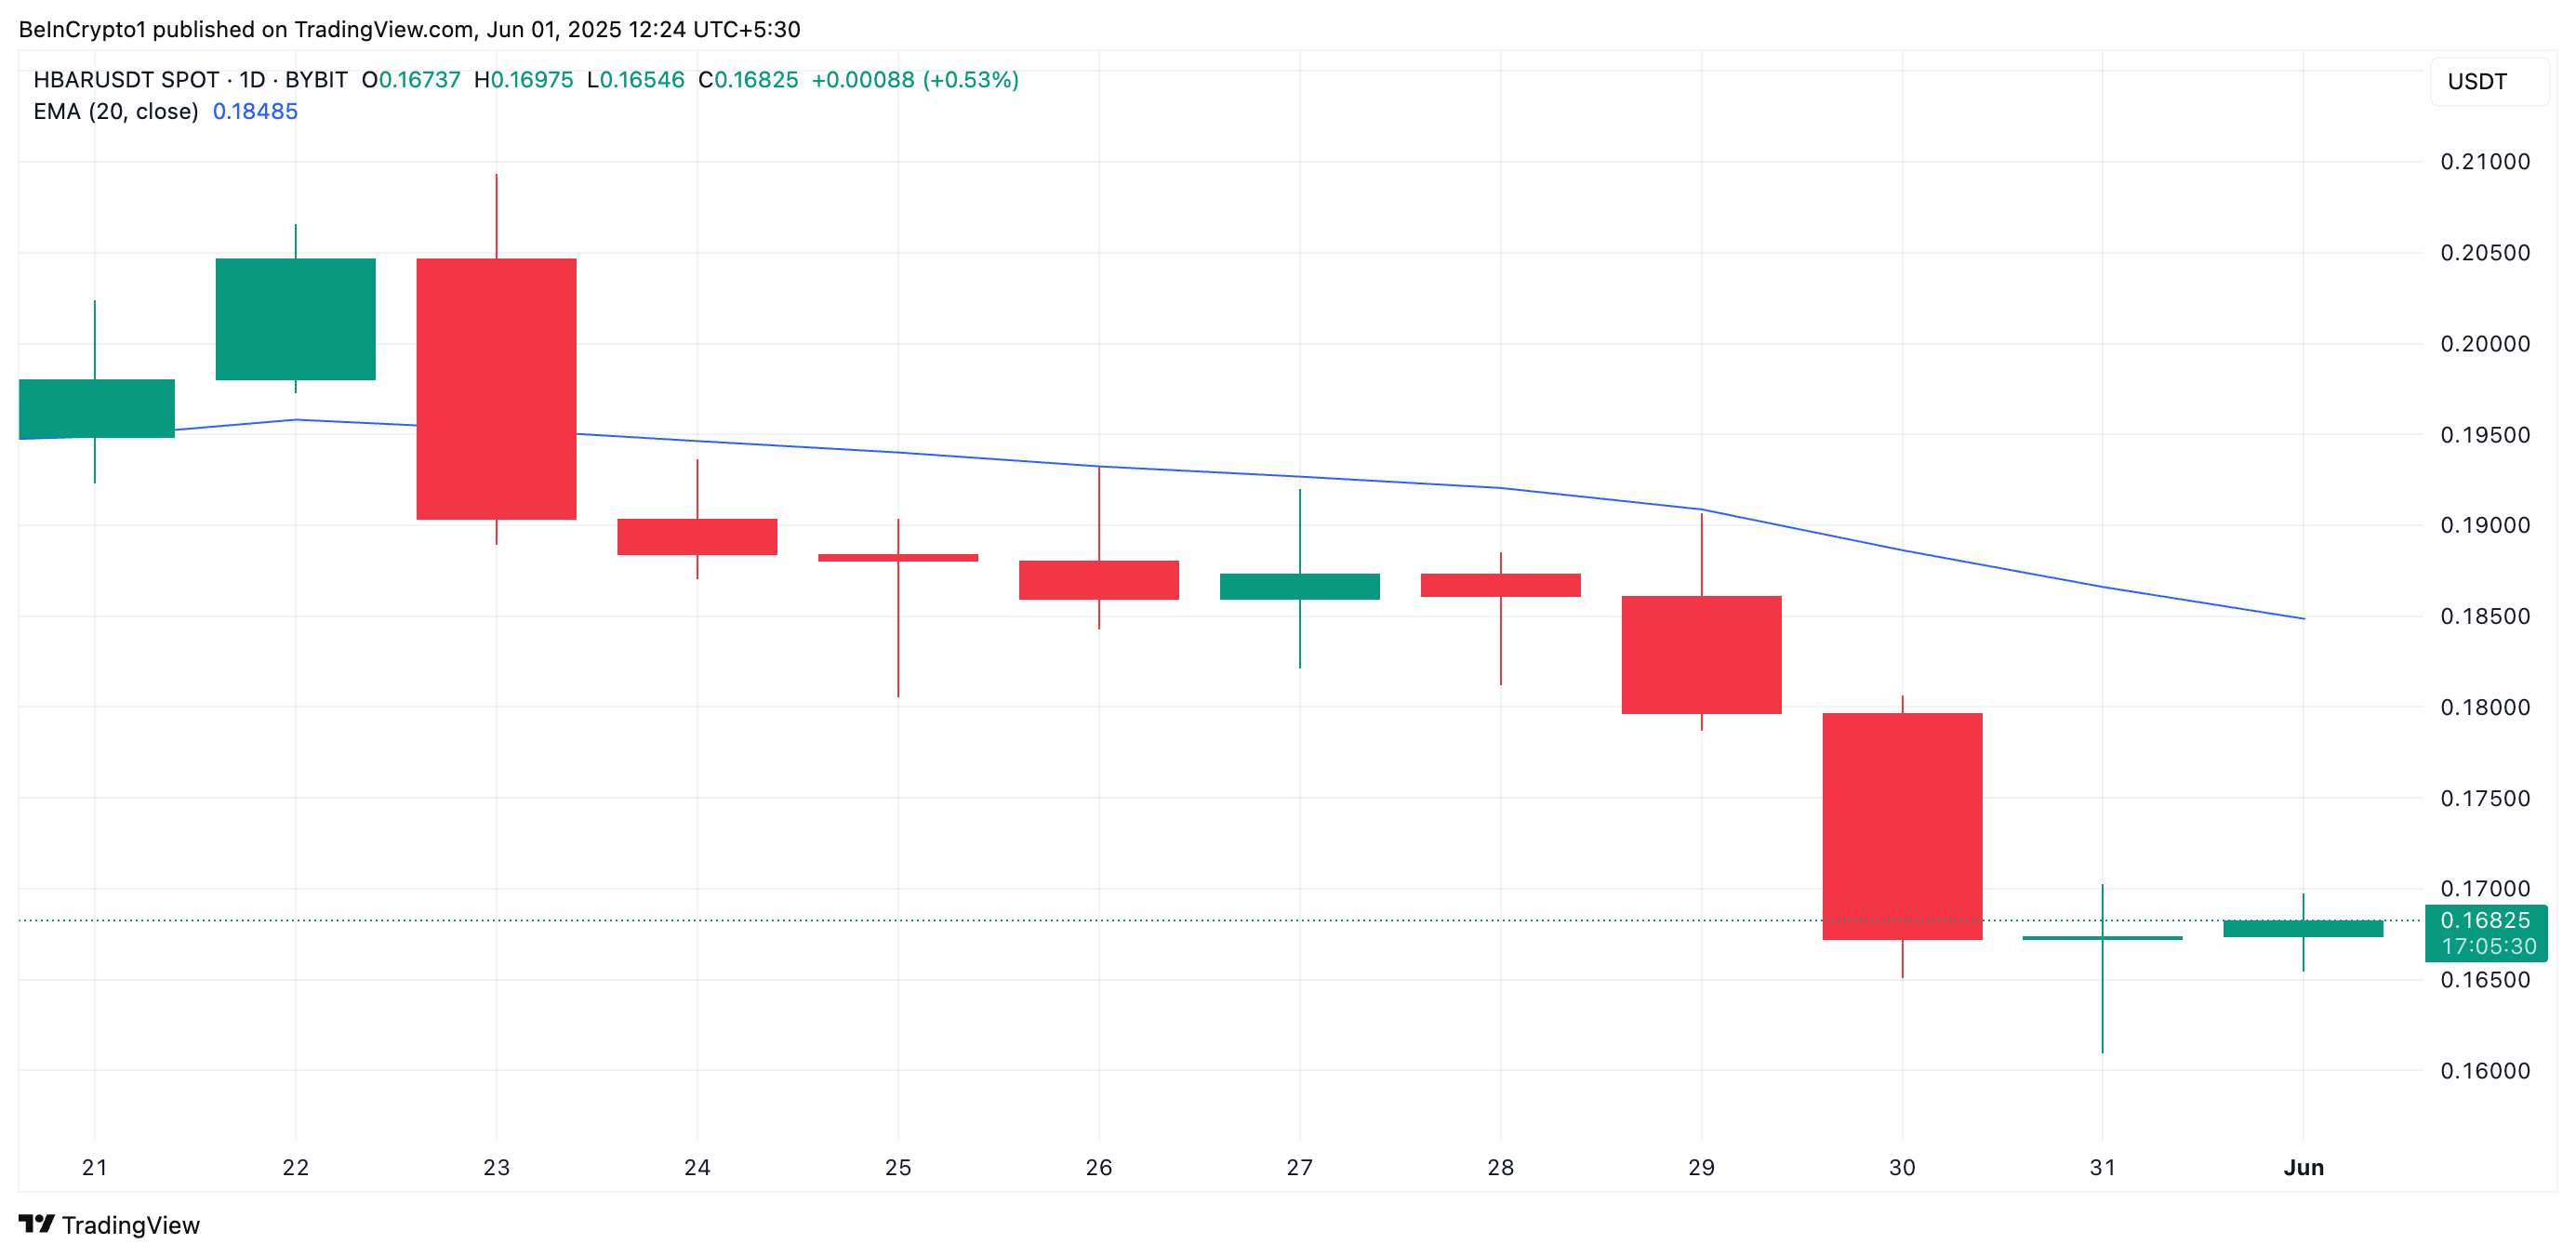 HBAR 20-Day EMA. Source:
TradingView
HBAR 20-Day EMA. Source:
TradingView
The 20-day EMA measures an asset’s average trading price over the past 20 trading days, giving weight to recent price changes.
When an asset falls below this key moving average, it signals a shift in short-term momentum from bullish to bearish. This breach typically suggests that recent selling pressure in the market outweighs buying interest, potentially triggering further downside.
Therefore, for HBAR, slipping below this key support level reinforces bearish sentiment and increases the likelihood of continued price weakness.
Further, the token’s Elder-Ray Index, which measures the strength of its bulls against the bears, shows continued dominance by sellers. The indicator’s red histogram bars remain below the zero line, printing -0.028 at press time.
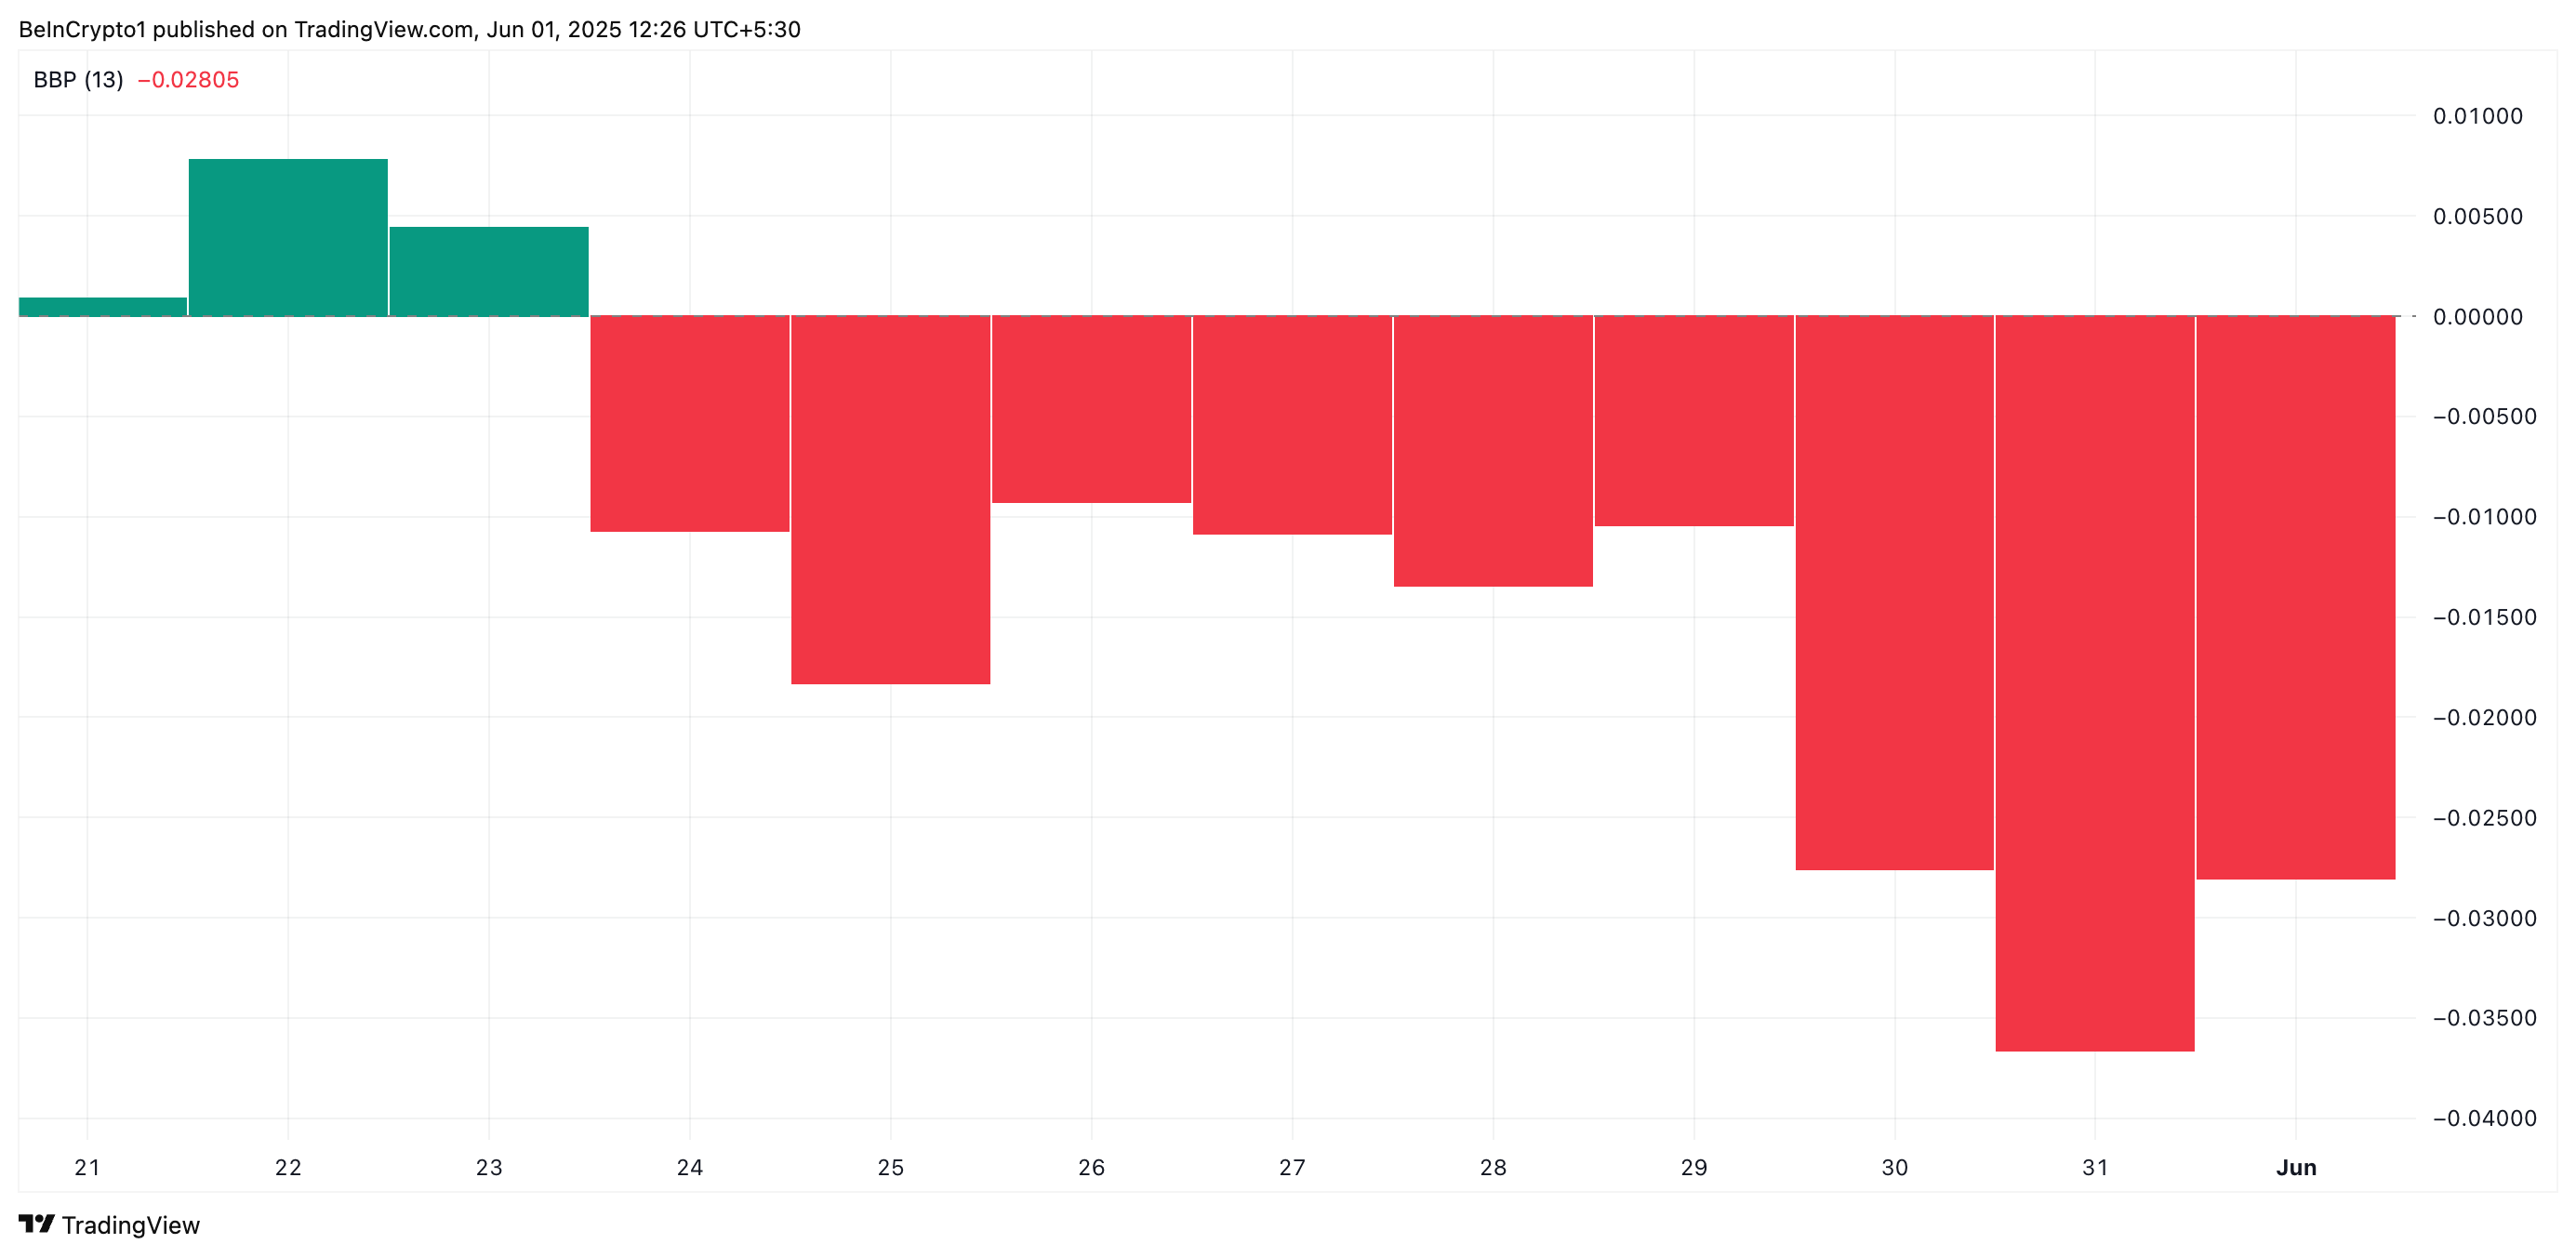 HBAR Elder-Ray Index. Source:
TradingView
HBAR Elder-Ray Index. Source:
TradingView
The indicator has persistently returned negative values since May 24, highlighting a lack of bullish power even during the recent price uptick.
Can Bulls Save HBAR? Price Eyes Critical Support at $0.153
HBAR currently trades at $0.168, with its 20-day EMA forming a dynamic resistance above it at $0.184. This suggests that any uptrend may face strong rejection unless buying momentum strengthens significantly.
Without a strong demand for HBAR, it could resume its decline and fall toward the support floor at $0.153. Should the bulls fail to defend this level, the price fall could deepen to reach $0.124.
 HBAR Price Analysis. Source:
TradingView
HBAR Price Analysis. Source:
TradingView
However, a resurgence in buying pressure will invalidate this bearish outlook. The token’s price could climb above the 20-day EMA to trade at $0.19 in that scenario.
Disclaimer: The content of this article solely reflects the author's opinion and does not represent the platform in any capacity. This article is not intended to serve as a reference for making investment decisions.
You may also like
Zcash (ZEC) To Dip Further? Key Breakdown Signals Potential Downside Move

Pepe (PEPE) Testing Crucial Support Post-Breakdown — Can a Retest Move Halt the Downtrend?

Bitcoin Updates Today: Bitcoin Declines While Altcoins Show Strength: Different Trends Suggest Market Recovery
- Bitcoin's prolonged slump below $90,000 contrasts with altcoin resilience as ETF outflows and fading Fed rate-cut hopes drive market correction. - On-chain data shows retail capitulation and subdued whale activity, historically signaling potential rebounds amid oversold technical indicators. - Institutional adoption and tokenized assets sustain long-term crypto optimism despite short-term volatility and unrealized losses in digital treasuries. - Diverging investor behavior highlights altcoin utility-driv

KITE's Price Movement After Listing and Institutional Perspectives: Managing Immediate Fluctuations and Sustained Worth in AI-Powered Real Estate
- KITE's post-IPO volatility reflects retail sector fragility and AI-driven industrial real estate opportunities amid macroeconomic headwinds. - Q3 2025 earnings missed forecasts (-$0.07 EPS, $205M revenue) as rate cuts and OBBBA fiscal impacts amplified REIT sensitivity to market shocks. - Strategic divestments of noncore retail assets and 7.4% dividend growth signal portfolio optimization, though opaque institutional ownership complicates sentiment analysis. - Industrial real estate's AI-powered logistic