The PI Crash Continues as Bears Dominate – What’s Next for Pi Network Price?

Pi Network (PI) is facing a technical standoff near $0.728, with fading momentum and a bearish chart setup weighing on short-term outlook.
Pi Network (PI) has been trading below $0.80 for the last three days, caught in a phase of consolidation just above a key support level. Technical indicators paint a cautious picture, with the Ichimoku Cloud showing persistent bearish pressure and the BBTrend momentum gauge turning negative.
The current setup suggests market indecision, as bulls struggle to reclaim control and sellers test the strength of nearby supports. With resistance levels still overhead and short-term momentum fading, PI’s next move could set the tone for the weeks ahead.
PI Faces Strong Resistance as Bearish Cloud Dominates Chart
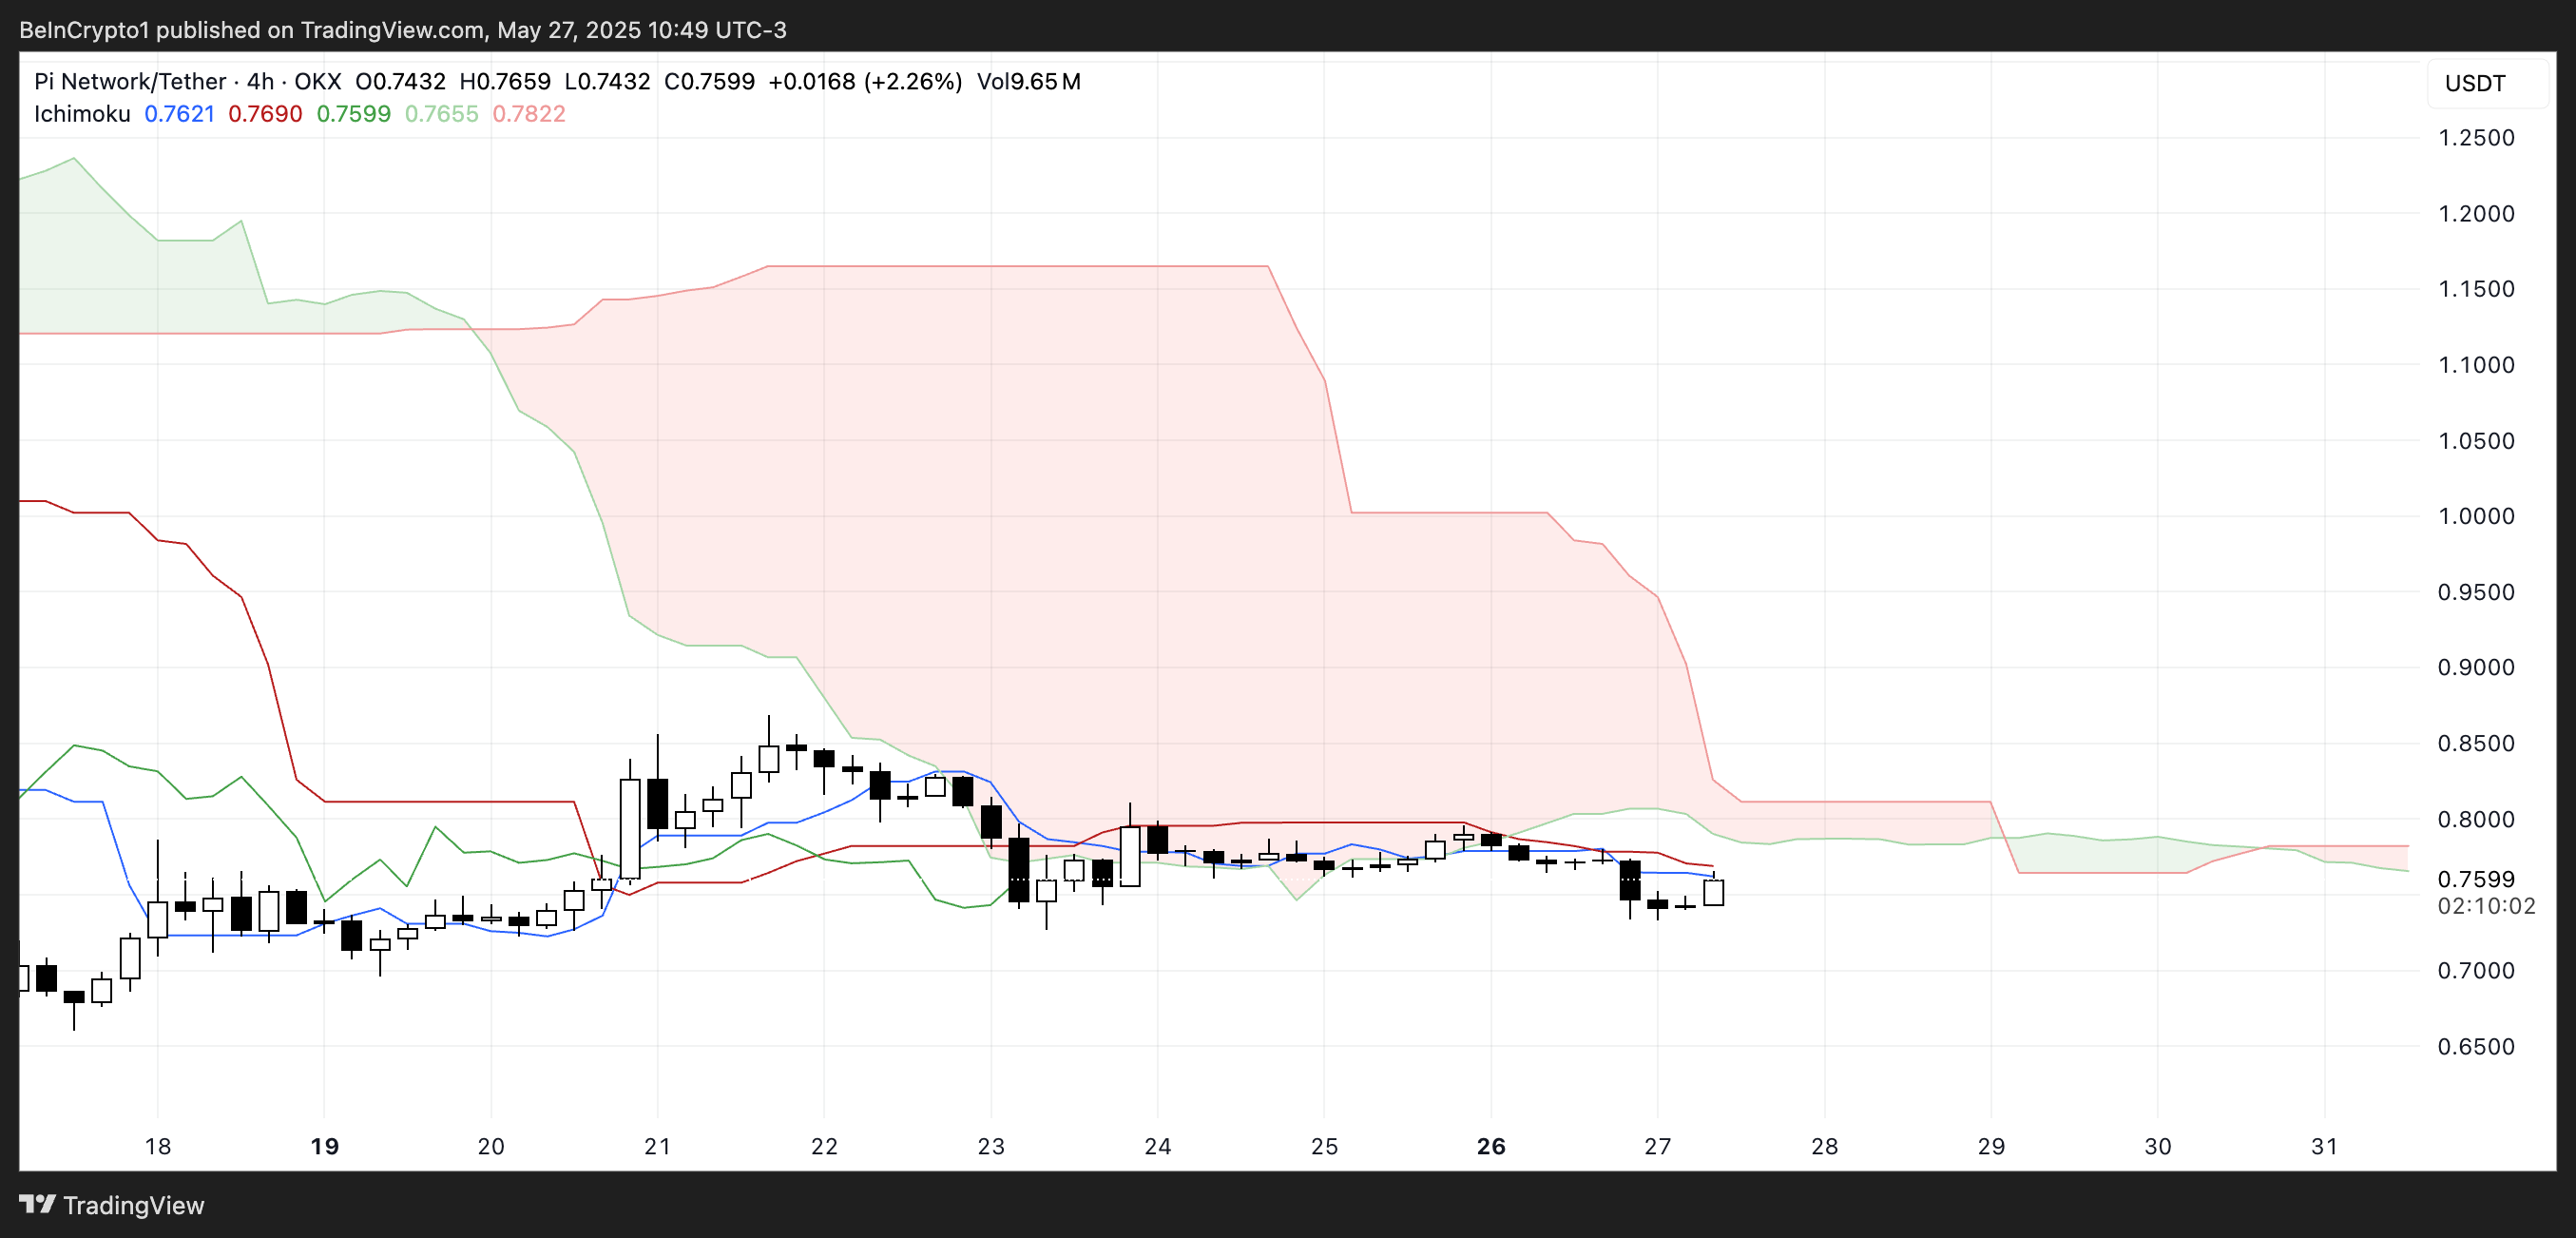
The Ichimoku Cloud chart for PI shows a predominantly bearish setup. The price action is below the red cloud (Kumo), indicating that the overall trend remains under downward pressure.
The Tenkan-sen (blue line) and Kijun-sen (red line) are flat and positioned above the recent candles, suggesting weak short-term momentum and limited bullish conviction.
The flat nature of these lines also reflects market indecision, as there hasn’t been a clear effort to break higher in recent sessions.
 PI Ichimoku Cloud. Source:
TradingView.
PI Ichimoku Cloud. Source:
TradingView.
Looking at the cloud ahead, it remains thick and red, which reinforces the idea that resistance will be strong soon.
The Senkou Span A (green cloud boundary) is below Senkou Span B (red boundary), maintaining a bearish Kumo twist. Additionally, the price has failed to break into or above the cloud, a signal that bulls have yet to regain control.
Until a clear breakout above the cloud with supportive momentum from the Tenkan-sen and Kijun-sen, the trend remains tilted in favor of sellers.
PI BBTrend Turns Negative, Signaling Loss of Bullish Momentum
The BBTrend (Bollinger Band Trend) indicator for Pi Network has flipped back into negative territory, currently sitting at -1.85 after holding in positive territory between May 22 and May 26.
During that period, it reached a peak of 8.71, signaling strong upward momentum.
However, the recent shift into the negative zone indicates growing bearish pressure, suggesting that the previous uptrend has weakened and the market may be entering a consolidation or correction phase.
 PI BBTrend. Source:
TradingView.
PI BBTrend. Source:
TradingView.
BBTrend is a momentum indicator that measures the strength and direction of price trends based on Bollinger Bands.
Positive values typically indicate that price is trending above the midline of the bands with expanding volatility—usually a bullish sign—while negative values reflect a move below the midline, often accompanied by contracting momentum or increasing downside pressure.
With PI’s BBTrend now at -1.85, the market is signaling a loss of bullish strength. Unless momentum reverses quickly, the price could remain under pressure or continue sliding in the near term.
PI Consolidates Near Key Support as Market Awaits Breakout
Pi Network has entered a consolidation phase over the past four days, with price action tightening and hovering just above a key support level.
The token is currently trading near $0.728, a zone that has acted as a short-term floor. If this support breaks, PI price could face increased selling pressure, opening the door for a drop toward $0.659.
In the event of a deeper downtrend, further declines toward $0.572 remain possible, making the current support level crucial for bulls to defend.
 PI Price Analysis. Source:
TradingView.
PI Price Analysis. Source:
TradingView.
On the upside, if PI can regain momentum and attract renewed buying interest, the first resistance to watch is around $0.869.
A break above that level would signal a potential trend reversal, setting up a move toward $1.30—which would mark the first return above $1 since May 14.
If the bullish momentum extends further, PI could test higher resistance levels near $1.67.
Disclaimer: The content of this article solely reflects the author's opinion and does not represent the platform in any capacity. This article is not intended to serve as a reference for making investment decisions.
You may also like
Bloomberg: As the crypto market crashes, the Trump family's and their supporters' wealth is shrinking significantly
The Trump family's wealth has shrunk by 1.1 billions US dollars, with ordinary investors becoming the biggest losers.

Why are most treasury DATs trading at a discount?
Is the DAT model truly a bridge connecting TradFi, or is it a "death spiral" for the crypto market?

Powell’s allies make a major statement: Is a December rate cut “reversal” now highly likely?
Economists point out that three of the most influential officials have formed a strong coalition in support of interest rate cuts, which will be difficult to challenge.

How We Build: Boundless Product Engineering and the Post-TGE Era
Now, thanks to the team's efforts, Boundless has become the first truly decentralized and permissionless protocol capable of handling any general-purpose ZKVM proof request.