Bitcoin Price Crash to $60,000? Here's What the Charts Say Now

Bitcoin (BTC) is currently dancing on a razor’s edge near $82,500, and traders are watching nervously. After a period of sideways consolidation, the crypto giant is showing early signs of weakness—raising the question: Is Bitcoin price preparing for a deep drop to $60,000 , or is this a bear trap before the next rally? Let’s dive into the daily and hourly charts to decode the truth behind BTC’s next major move.
Bitcoin Price Prediction: Is the Daily Chart Flashing Bearish Warnings?
 BTC/USD Daily Chart- TradingView
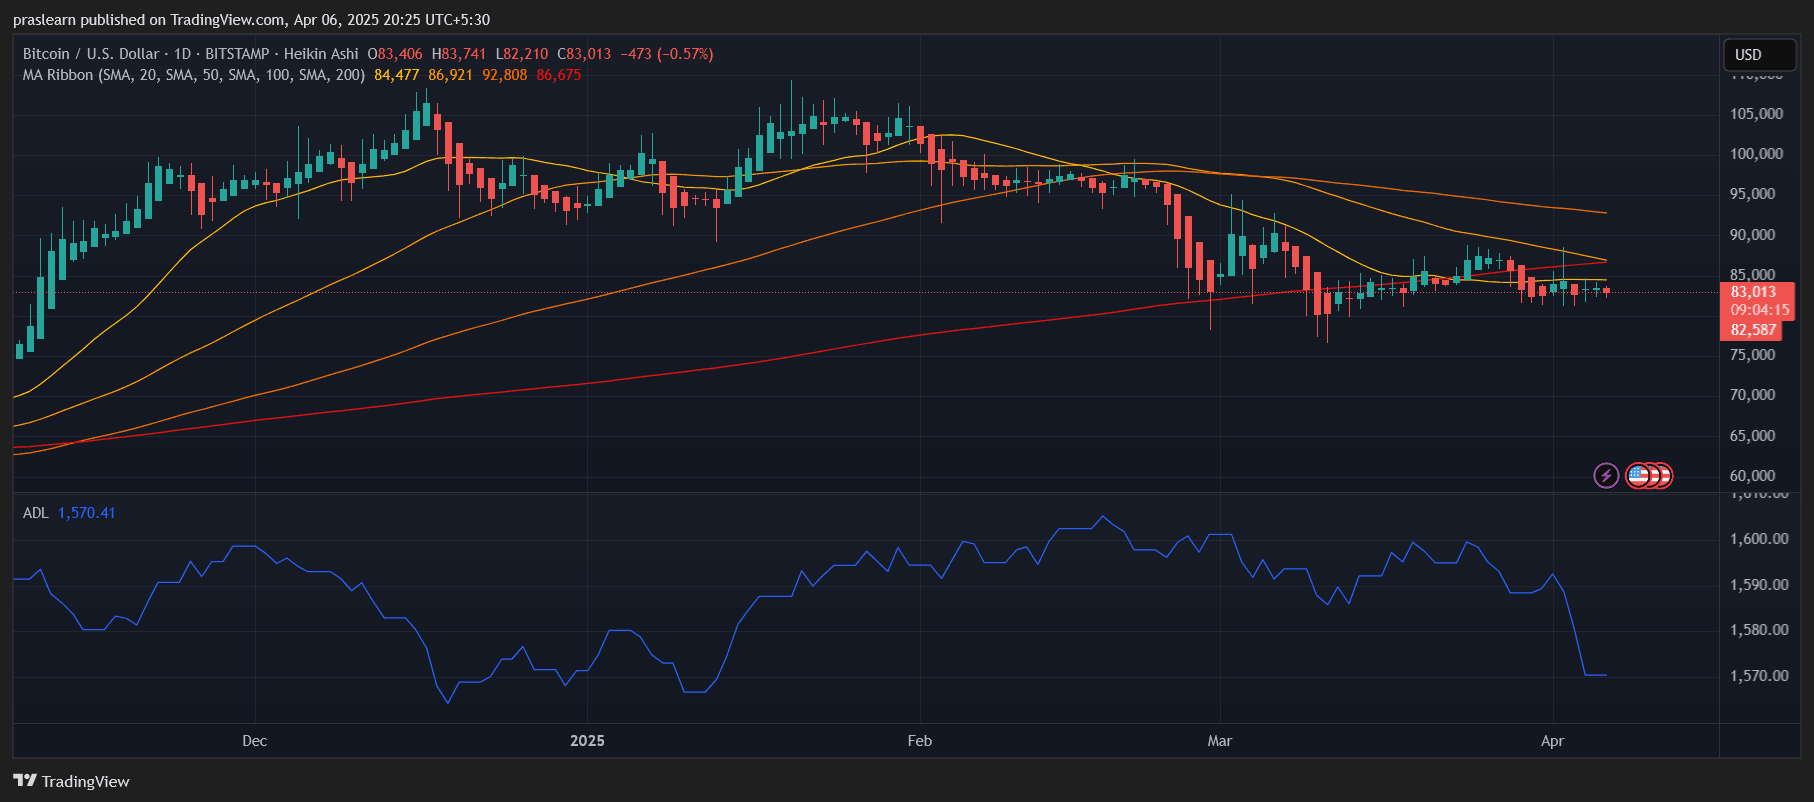
On the daily chart, Bitcoin continues to struggle below major resistance levels. The Heikin Ashi candles are small-bodied and red, signaling a lack of momentum and indecision in the market. Price action is firmly below all major moving averages—with the 20 SMA at $84,477, 50 SMA at $86,921, and 100 SMA at $92,808. This alignment indicates a clear bearish structure where each rally is being sold into.
What’s more concerning is that Bitcoin has failed multiple times to reclaim the 100-day SMA, indicating sustained selling pressure from institutions and swing traders. The presence of the 200 SMA below current price around $86,675 had acted as a temporary support in March, but it has now turned neutral as price hovers well below it.
The ADL (Accumulation/Distribution Line) has sharply dropped, confirming distribution over accumulation. This means that even during slight upward moves, smart money has been offloading, not adding to positions. Without a turn in the ADL, any bounce is suspect.
Bitcoin Crash: What Does the Hourly Chart Reveal About Short-Term Momentum?
 BTC/USD 1 hr chart- TradingView
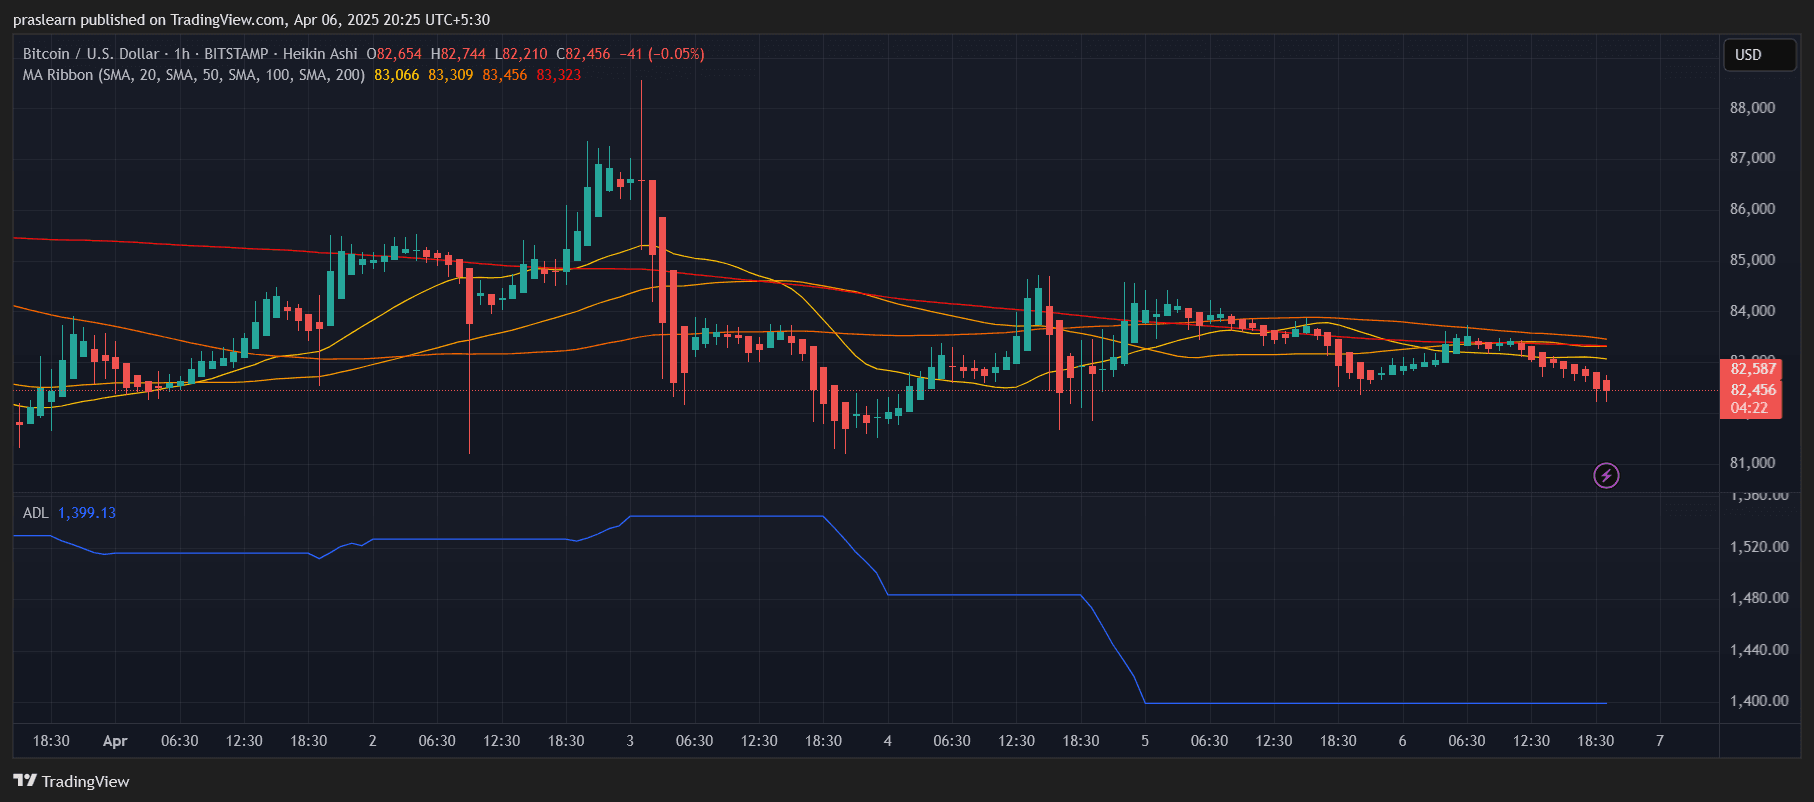
Zooming into the 1-hour chart, the picture becomes even more clear: Bitcoin is grinding downward in a slow, controlled bleed. After peaking briefly around $87K on April 2nd, BTC experienced sharp rejection and has since been forming lower highs. The recent attempt to climb was stopped cleanly at the 200 SMA near $83,300, confirming it as short-term resistance.
The moving averages on the hourly (20, 50, and 100 SMA) are compressing and curving downward, which typically leads to momentum breakdowns, especially when paired with flat volume and fading bullish candles. The most recent Heikin Ashi candles are small-bodied and leaning bearish, showing that the bulls are losing steam and failing to defend even intraday bounces.
The hourly ADL is declining, further confirming the lack of demand at current price levels. Retail interest appears low, and there’s no sign of whale-driven accumulation on this timeframe either.
Bitcoin Crash: Where Are Bitcoin’s Key Support and Resistance Levels?
Immediate support lies at $82,000, which has been tested several times over the past few sessions. A decisive break below this level could trigger a sharp selloff down to $78,500, with a psychological and structural support zone around $75,000. If that fails, then the long-feared move toward $69,000–$60,000 could come into play quickly.
On the upside, resistance sits heavy around $84,500, followed by $86,900, both marked by the daily 20 and 50 SMA zones. Only a break above $87,500–$88,000, backed by volume, would confirm a bullish reversal and negate the current bearish setup.
What Do the Indicators Suggest?
- Moving Averages: Across both timeframes, BTC price is trapped below all critical moving averages. This is a textbook sign of a sustained downtrend. The squeeze of shorter SMAs on the hourly suggests a potential spike in volatility soon—likely downward if support breaks.
- Heikin Ashi Candles: Candles are weak and indecisive across both daily and hourly charts. This indicates exhaustion and a lack of trend commitment from either bulls or bears, but in the current context, it's leaning bearish.
- ADL (Accumulation/Distribution Line): This is the clearest red flag. The sharp drop in the ADL on the daily chart suggests strong selling and no meaningful accumulation. Until this reverses, upside moves are likely to be short-lived.
Bitcoin Price Prediction: What’s Next for April?
Short-Term Outlook (Next 48–72 hours): If $82,000 fails, expect a fast drop to $78,000 or lower. If bulls hold the line and reclaim $84,500 with volume, we might see a short-term bounce to $87K.
Mid-Term Outlook (Next 1–2 weeks): Without a break above the 100-day SMA, Bitcoin price is at risk of cascading down to $75,000. Market sentiment is fragile, and macroeconomic news or ETF flows could tip the balance.
Long-Term Outlook (Rest of April 2025): If $75,000 breaks in April, then a full correction down to $60,000 is on the table. However, if bulls manage to regain $90K territory, it could open the door back to $100K.
Is a Bitcoin Crash Coming?
The charts are clear—Bitcoin price is at a critical level. The current structure favors bears, with no strong signs of reversal just yet. Accumulation is weak, momentum is fading, and major resistances are pushing BTC price lower. Unless bulls step in with force soon, a deep correction could be just around the corner.
So, is Bitcoin price heading for $60,000 or ready to bounce? For now, the trend says: Proceed with caution.
Bitcoin (BTC) is currently dancing on a razor’s edge near $82,500, and traders are watching nervously. After a period of sideways consolidation, the crypto giant is showing early signs of weakness—raising the question: Is Bitcoin price preparing for a deep drop to $60,000 , or is this a bear trap before the next rally? Let’s dive into the daily and hourly charts to decode the truth behind BTC’s next major move.
Bitcoin Price Prediction: Is the Daily Chart Flashing Bearish Warnings?
BTC/USD Daily Chart- TradingView
On the daily chart, Bitcoin continues to struggle below major resistance levels. The Heikin Ashi candles are small-bodied and red, signaling a lack of momentum and indecision in the market. Price action is firmly below all major moving averages—with the 20 SMA at $84,477, 50 SMA at $86,921, and 100 SMA at $92,808. This alignment indicates a clear bearish structure where each rally is being sold into.
What’s more concerning is that Bitcoin has failed multiple times to reclaim the 100-day SMA, indicating sustained selling pressure from institutions and swing traders. The presence of the 200 SMA below current price around $86,675 had acted as a temporary support in March, but it has now turned neutral as price hovers well below it.
The ADL (Accumulation/Distribution Line) has sharply dropped, confirming distribution over accumulation. This means that even during slight upward moves, smart money has been offloading, not adding to positions. Without a turn in the ADL, any bounce is suspect.
Bitcoin Crash: What Does the Hourly Chart Reveal About Short-Term Momentum?
BTC/USD 1 hr chart- TradingView
Zooming into the 1-hour chart, the picture becomes even more clear: Bitcoin is grinding downward in a slow, controlled bleed. After peaking briefly around $87K on April 2nd, BTC experienced sharp rejection and has since been forming lower highs. The recent attempt to climb was stopped cleanly at the 200 SMA near $83,300, confirming it as short-term resistance.
The moving averages on the hourly (20, 50, and 100 SMA) are compressing and curving downward, which typically leads to momentum breakdowns, especially when paired with flat volume and fading bullish candles. The most recent Heikin Ashi candles are small-bodied and leaning bearish, showing that the bulls are losing steam and failing to defend even intraday bounces.
The hourly ADL is declining, further confirming the lack of demand at current price levels. Retail interest appears low, and there’s no sign of whale-driven accumulation on this timeframe either.
Bitcoin Crash: Where Are Bitcoin’s Key Support and Resistance Levels?
Immediate support lies at $82,000, which has been tested several times over the past few sessions. A decisive break below this level could trigger a sharp selloff down to $78,500, with a psychological and structural support zone around $75,000. If that fails, then the long-feared move toward $69,000–$60,000 could come into play quickly.
On the upside, resistance sits heavy around $84,500, followed by $86,900, both marked by the daily 20 and 50 SMA zones. Only a break above $87,500–$88,000, backed by volume, would confirm a bullish reversal and negate the current bearish setup.
What Do the Indicators Suggest?
- Moving Averages: Across both timeframes, BTC price is trapped below all critical moving averages. This is a textbook sign of a sustained downtrend. The squeeze of shorter SMAs on the hourly suggests a potential spike in volatility soon—likely downward if support breaks.
- Heikin Ashi Candles: Candles are weak and indecisive across both daily and hourly charts. This indicates exhaustion and a lack of trend commitment from either bulls or bears, but in the current context, it's leaning bearish.
- ADL (Accumulation/Distribution Line): This is the clearest red flag. The sharp drop in the ADL on the daily chart suggests strong selling and no meaningful accumulation. Until this reverses, upside moves are likely to be short-lived.
Bitcoin Price Prediction: What’s Next for April?
Short-Term Outlook (Next 48–72 hours): If $82,000 fails, expect a fast drop to $78,000 or lower. If bulls hold the line and reclaim $84,500 with volume, we might see a short-term bounce to $87K.
Mid-Term Outlook (Next 1–2 weeks): Without a break above the 100-day SMA, Bitcoin price is at risk of cascading down to $75,000. Market sentiment is fragile, and macroeconomic news or ETF flows could tip the balance.
Long-Term Outlook (Rest of April 2025): If $75,000 breaks in April, then a full correction down to $60,000 is on the table. However, if bulls manage to regain $90K territory, it could open the door back to $100K.
Is a Bitcoin Crash Coming?
The charts are clear—Bitcoin price is at a critical level. The current structure favors bears, with no strong signs of reversal just yet. Accumulation is weak, momentum is fading, and major resistances are pushing BTC price lower. Unless bulls step in with force soon, a deep correction could be just around the corner.
So, is Bitcoin price heading for $60,000 or ready to bounce? For now, the trend says: Proceed with caution.
Disclaimer: The content of this article solely reflects the author's opinion and does not represent the platform in any capacity. This article is not intended to serve as a reference for making investment decisions.
You may also like
Bitcoin Holds the $84,000 Support Like a Champion: Oversold Rebound Targets $94,000 This Week
Bitcoin has successfully held the $84,000 support level and may rebound to $94,000 this week. If it falls below $80,000, it could further drop to $75,000. Although market sentiment is extremely bearish, a short-term oversold condition may trigger a rebound. Summary generated by Mars AI This summary was generated by the Mars AI model, and its accuracy and completeness are still being updated iteratively.

What will happen to the price of DOGE after the listing of Grayscale's GDOG ETF?
Dogecoin's price is being suppressed by resistance at $0.1495, with short-term support at $0.144. Grayscale's DOGE ETF debut failed to boost the price, and continued whale sell-offs are exerting further pressure. Technical analysis indicates a neutral-to-bearish trend, lacking clear reversal signals. Summary generated by Mars AI. This summary was generated by the Mars AI model, and the accuracy and completeness of its content are still undergoing iterative updates.

BitMine spends heavily again to buy 70,000 ETH! Holdings surpass 3% of total circulating supply; Tom Lee: Ethereum's worst-case scenario is a drop to $2,500
BitMine Immersion Technologies increased its holdings by 69,822 ETH, bringing its total holdings to 3.62 million ETH, which accounts for 3% of the circulating supply, with total assets of $11.2 billions. Tom Lee believes that ETH's risk/reward is asymmetric, with limited downside potential. Summary generated by Mars AI. The accuracy and completeness of this summary are still being iteratively improved by the Mars AI model.