SHIB’s Downward Pressure Grows: A Breakdown Below Support


- SHIB is testing key support at 0.00001079 USD with a high potential of a breakdown.
- Fibonacci levels indicate potential further downside for SHIB if support fails.
- MACD and RSI indicators suggest bearish momentum is in control of Shiba Inu’s price.
Shiba Inu has shown signs of weakness on the 7-day chart, indicating the possibility of a price dip in the upcoming weeks. Currently priced at 0.00001489 USD, SHIB is trading within a narrowing channel, which suggests a high chance of a breakdown. The token now tests a supportive zone at the 0.00001079 USD mark, a price it has held fast within the last months. Should this level be breached, SHIB could come under further pressure to the downside, making the bearish outlook in the market permanent.
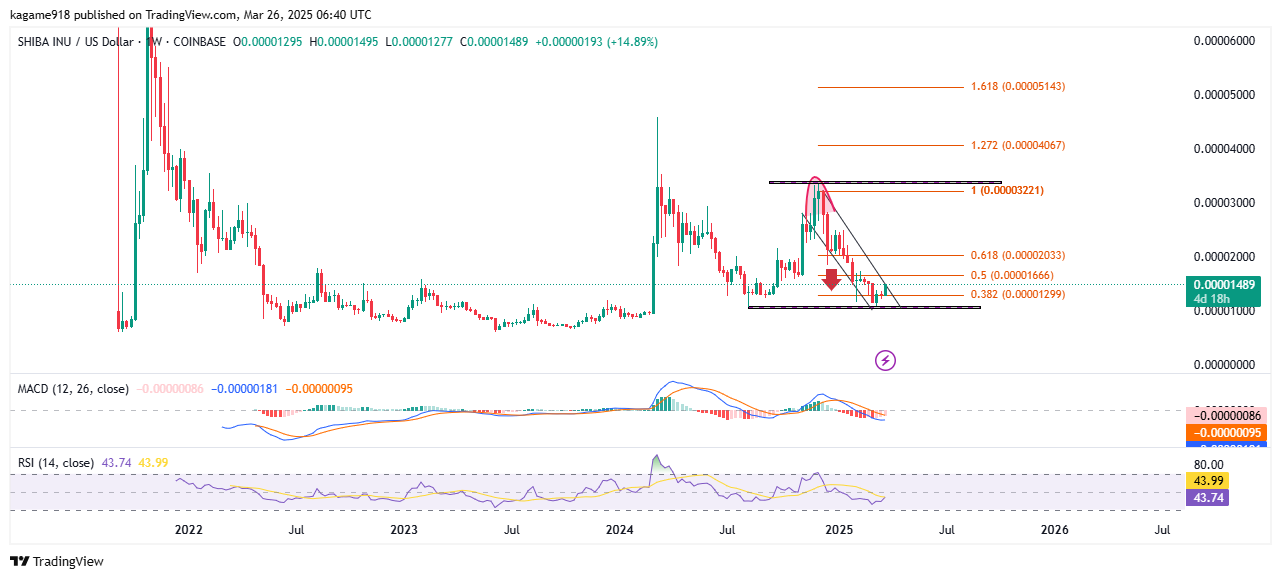
Source: Tradingview
Support and Resistance Levels in Focus
The current support level for SHIB is 0.00001079 USD, often referred to as a key level for traders that has seen consistent testing through recent price action. However, with price action narrowing on the chart, SHIB may see a break beneath this support, with further decline of the token’s value.
On the resistance side, SHIB has been encountering strong resistance at 0.00003221 USD, marked by the Fibonacci retracement level of 1.0. This is a critical zone for SHIB, as any further rally will likely face resistance at this point. The token has made several attempts to break past this resistance but has failed to sustain upward momentum. This price range will be watched closely by market participants, as a breakout above 0.00003221 USD could signal a reversal in the current trend.
Related: Shiba Inu’s Technical Levels Show Room for a Bullish Move
Fibonacci Analysis: Potential for Further Downside
A further survey of SHIB’s price through Fibonacci retracement levels has revealed that the token has currently settled down at the 0.382 level located at 0.00001299 USD. This is a high level at which the breach below could indicate further downside. The Fibonacci tool also delineates a concern of a number of points above the price of 0.5 retracements of 0.00001666 USD and 0.618 in 0.00002033 USD, and may offer possible resistance should SHIB manage to retrace its steps.
However, the present price action with directions in the triangle formation should indicate SHIB in the future facing a collapse. The MACD indicator further assures this possibility, as it remains in bearish territory with a negative histogram, suggesting that selling momentum is still in play. The RSI, hovering around 43.74, is also signaling neutral conditions, but its inability to break into the overbought territory could indicate a lack of strong buying pressure.
The post SHIB’s Downward Pressure Grows: A Breakdown Below Support appeared first on Cryptotale.
Disclaimer: The content of this article solely reflects the author's opinion and does not represent the platform in any capacity. This article is not intended to serve as a reference for making investment decisions.
You may also like
Bitcoin Experiences Steep Drop: What Causes the Sudden Sell-Off?
- Bitcoin plummeted 30% in November 2025, erasing $1 trillion in market cap amid macroeconomic pressures and institutional profit-taking. - Central bank uncertainty (Fed, ECB) and leveraged liquidations amplified the selloff, with ETF outflows exceeding $3.79 billion. - Bitcoin's 0.90 correlation with the S&P 500 highlighted its shift from "digital gold" to risk-on asset, contrasting gold's 55% surge. - On-chain metrics revealed structural weaknesses: hash rate declines, miner revenue drops, and divergent

PENGU USDT Sell Alert and Stablecoin Price Fluctuations: Evaluating Algorithmic Dangers Amid Changing Cryptocurrency Markets
- PENGU USDT's 2025 volatility reignited debates on algorithmic stablecoin fragility amid regulatory uncertainty and post-UST market skepticism. - Technical analysis showed conflicting signals: overbought MFI vs bearish RSI divergence, with critical support/resistance levels at $0.010-$0.013. - $66.6M team wallet outflows and 32% open interest growth highlighted liquidity risks, while UST's collapse legacy exposed algorithmic design flaws. - Investors increasingly favor fiat-backed alternatives like USDC ,
HYPE Token Experiences Rapid Growth in December 2025: Evaluating Authenticity and Investment Opportunities Amidst an Unstable Post-ETF Cryptocurrency Landscape
- HYPE token surged in Dec 2025 amid post-Bitcoin ETF crypto optimism , raising questions about its investment legitimacy. - Hyperliquid's 72.7% decentralized trading volume share and $106M monthly revenue highlight its DeFi infrastructure strength. - Institutional backing from Paradigm and a $1B DAT fund signals confidence, though major exchange listings remain pending. - Price volatility, token unlocks, and mixed expert opinions underscore risks, with potential $53–$71 targets contingent on market condit
LUNA Falls by 5.77% Over 24 Hours Despite Fluctuating Medium-Term Performance
- LUNA fell 5.77% in 24 hours to $0.1512, but rose 47.52% in 7 days and 105.96% in 30 days. - However, it still faces a 64.14% annual loss, highlighting crypto market volatility and long-term risks for investors. - The price swing reflects sensitivity to macroeconomic shifts and sentiment, with analysts noting ongoing uncertainty in forecasts. - Investors are weighing recent resilience against regulatory challenges and institutional behavior shifts, monitoring if the drop signals a bearish trend or tempora