

Archer Daniels Midland
Dernière mise à jour : 2026-07-09 11:55 EST. Les données sur les prix des actions proviennent de TradingView et reflètent les prix du marché en temps réel.
Variation du cours des actions ADM
ADM – Données clés

Bitget ouvre l'ère Stocks 2.0 :
Une nouvelle façon de trader des actions – n'importe où, 24h/7j
Accédez à la liquidité de Wall Street, au versement de dividendes et à la prise en charge de la marge Futures.
En savoir plusArcher Daniels Midland – Vue d'ensemble
Baromètre ADM en temps réel
Mises à jour quotidiennes sur le prix de l'action ADM, les flux de capitaux et les actualités de marché, générées par l'IA et vérifiées par notre équipe d'analystes. Faites toujours vos propres recherches.
Prévisions du prix de l'action ADM
Selon les indicateurs techniques pour l'action ADM, le cours devrait fluctuer dans une fourchette comprise entre 77.19 et 86.40 USD au cours de la semaine prochaine. Les analystes de marché prévoient que le cours de l'action ADM devrait fluctuer dans une fourchette comprise entre 69.57 et 101.55 USD au cours des prochains mois.
Selon les prévisions de prix à un an de 58 analystes, l'estimation la plus haute est de 237.80 USD, tandis que la plus basse est de 70.99 USD.
Actions tendance
Trader des actions Spot sur Bitget
Trader des Perps sur actions Bitget
À propos de Bitget
Dernières actualités de l'action ADM
Le chiffre d'affaires du quatrième trimestre d'ADM, négociant américain de céréales, est inférieur aux attentes, avec un bénéfice net en baisse de 19,6 % en glissement annuel.
Archer Aviation Inc. (Archer) a récemment publié son rapport sur les résultats du quatrième trimestre et de l'année fiscale 2025.
Selon les derniers documents publiés par la SEC, certains actionnaires existants d'Archer Aviation Inc., fabricant de véhicules aériens électriques, prévoient de vendre jusqu'à 5,3 millions d'actions ordinaires de classe A de la société.
Selon le dernier dossier de la SEC, certains actionnaires existants d'Archer Aviation Inc., fabricant d'aéronefs électriques, prévoient de vendre jusqu'à 5,3 millions d'actions ordinaires de classe A de la société.
L'opérateur américain de taxis aériens Archer Aviation Inc. réalise une avancée majeure
Les performances de l’« ASML américaine » explosent ! Les revenus trimestriels de Lam Research atteignent un record, le PDG affirme que l’année prochaine sera aussi « très bonne »
Archer Financial a publié ses derniers résultats trimestriels, enregistrant un bénéfice net de 13,5 millions de dollars au premier trimestre, soit un bénéfice par action de 0,82 dollar.
Petit-déjeuner financier du 6 mai : l'accord de cessez-le-feu entre les États-Unis et l'Iran se poursuit, le "Plan Liberté" suspendu, le prix de l'or rebondit après avoir touché le fond pour tester les 4600, le pétrole américain passe sous la barre des 100.
Le PDG de Lam Research : se concentrer sur l’IA dans les outils pour puces et prévoir une expansion des activités aux États-Unis.
L'informatique quantique connaît un nouveau catalyseur ! 8 contrats à effet de levier 20x sur des actions américaines populaires sont lancés en force [Tirage hebdomadaire pour des frais à vie gratuits, actions américaines offertes gratuitement]
Trump frappe fort ! Le secteur des drones s’échauffe, 2026 pourrait devenir une tendance majeure pour l’investissement, 7 actions conceptuelles pourraient en bénéficier【Zhouzhou 0 frais, actions offertes gratuitement】
Découvrez les principaux avantages de Bitget US Stocks 2.0 en un seul article ! Profitez également d'offres limitées : participez pour partager 200 000 dollars Nvidia.
Le chiffre d'affaires du quatrième trimestre d'ADM, négociant américain de céréales, est inférieur aux attentes, avec un bénéfice net en baisse de 19,6 % en glissement annuel.
Archer Aviation Inc. (Archer) a récemment publié son rapport sur les résultats du quatrième trimestre et de l'année fiscale 2025.
Selon les derniers documents publiés par la SEC, certains actionnaires existants d'Archer Aviation Inc., fabricant de véhicules aériens électriques, prévoient de vendre jusqu'à 5,3 millions d'actions ordinaires de classe A de la société.
Selon le dernier dossier de la SEC, certains actionnaires existants d'Archer Aviation Inc., fabricant d'aéronefs électriques, prévoient de vendre jusqu'à 5,3 millions d'actions ordinaires de classe A de la société.
L'opérateur américain de taxis aériens Archer Aviation Inc. réalise une avancée majeure
Les performances de l’« ASML américaine » explosent ! Les revenus trimestriels de Lam Research atteignent un record, le PDG affirme que l’année prochaine sera aussi « très bonne »
ADM concurrents
| Nom | Capitalisation | Prix | Variation (%) | Ratio P/E | BPA dilué (sur 12 mois) | Rendement du dividende (sur 12 mois) |
|---|---|---|---|---|---|---|
26.80BUSD | 120.22USD | -3.08% | 17.22 | 6.980 USD | 2.36% | |
20.08BUSD | 37.92USD | -1.71% | 0.00 | -6.319 USD | 4.88% | |
 Amcor AMCR | 20.55BUSD | 44.45USD | -0.38% | 30.63 | 1.451 USD | 5.82% |
 Bunge BG | 21.52BUSD | 110.91USD | +1.96% | 25.81 | 4.297 USD | 2.54% |
23.53BUSD | 45.00USD | -1.40% | 62.71 | 0.718 USD | 3.92% | |
20.71BUSD | 232.40USD | -1.69% | 28.27 | 8.221 USD | 2.26% |


Nouvelles tendances du secteur boursier et stratégie de Bitget pour le trading d'actions
La tokenisation d'actions émerge comme une tendance majeure à l'intersection de la finance traditionnelle et du marché des cryptomonnaies. En transférant des actifs tels que les actions sur la blockchain et en permettant un trading mondial 24h/24, 7j/7, elle améliore l'accessibilité, l'efficacité et la transparence pour les investisseurs.
Bitget considère le trading d'actions comme un axe stratégique clé pour le développement de sa plateforme. Celle-ci prend actuellement en charge le trading de tokens d'actions et de Perps sur actions, et s'est déjà imposée comme un acteur majeur dans ce secteur.
Les principaux avantages des Perps sur actions Bitget résident dans leur innovation et leur conception axée sur l'utilisateur :
1. Première mondiale : les premiers Perps sur indices d'actions tokenisées du secteur, indexés sur de multiples sources de prix pour une transparence et une sécurité accrues.
2. Effet de levier élevé : permet de trader avec un effet de levier allant jusqu'à 25x, optimisant ainsi l'efficacité du capital et les rendements potentiels.
3. Diversité des actifs sous-jacents : couvre des centaines d'actions populaires et permet une large variété de stratégies de trading.
4. Frais de transaction réduits : les frais sont plafonnés à 0,06%, ce qui réduit les coûts pour les traders à haute fréquence.
5. Mécanisme de calcul de l'indice : basé sur les prix en USDT des actifs tokenisés provenant de différents émetteurs (ex. : xStocks, Ondo). Les pondérations sont recalculées régulièrement, ou lors d'événements de marché majeurs, afin de garantir que l'indice reste aligné sur les conditions du marché.
Début décembre 2025, Bitget a enregistré plus de 18 milliards de dollars de volume de trading sur le marché des Perps sur actions, ce qui en fait l'une des plateformes les plus populaires pour les tokens d'actions et les Perps sur actions. D'ici la fin de l'année 2026, le volume de trading cumulé de Bitget sur le marché des Perps sur actions devrait dépasser les 100 milliards de dollars.
Poursuivez votre lecture pour en savoir plus sur les actifs disponibles au trading sur Bitget, ainsi que pour obtenir des informations détaillées sur les tokens d'actions et les Perps sur actions de Bitget.


Principales différences entre Bitget et les courtiers traditionnels
Quels sont les principaux avantages de Bitget Stocks 2.0 ?
1. Accédez à la profondeur de marché des actions américaines réelles avec un trading rapide et à faible latence.
2. Tradez des actions adossées 1:1 à de véritables actifs sous-jacents, avec des dividendes crédités directement sur votre compte.
3. Utilisez vos actifs d'actions dans l'ensemble de l'écosystème de marge et de rendement de Bitget.
Comment commencer à trader des actions sur Bitget ?
1. Créez un compte et effectuez la vérification de l'identité.
2. Déposez des USDT sur votre compte Spot.
3. Accédez à la section de trading d'actions.
4. Placez des ordres et gérez vos positions.
Articles liés aux tokens d'actions et aux Perps sur actions
En tant que plateforme d'échange de cryptomonnaies leader, Bitget propose une large gamme de produits dérivés, incluant des Futures perpétuels crypto classiques (comme BTCUSDT et ETHUSDT) et des stock perps — des Futures perpétuels margés en USDT suivant des indices boursiers américains tokenisés (tels que TSLA, NVDA, AAPL).
Les deux types de produits prennent en charge l’effet de levier, le mode de couverture (long/short) et le règlement en USDT. Ce sont également des Futures perpétuels sans échéance, utilisant un mécanisme de taux de financement pour maintenir les prix ancrés au prix Spot des actifs sous-jacents. Cependant, ils diffèrent fortement en termes de caractéristiques des actifs sous-jacents, de volatilité, de profil de risque et d’expérience de trading globale. Les stock perps permettent d’amplifier les gains avec l’effet de levier tout en s’appuyant sur des fondamentaux relativement stables et la surveillance réglementaire du marché actions américain. Comparés aux purs Futures crypto, ils sont bien moins sujets aux variations de prix extrêmes (comme des flash crash), rendant le risque global plus gérable. Ils constituent donc un choix idéal pour les traders cherchant à mêler la stabilité de la finance traditionnelle à la flexibilité de la crypto.
Atouts clés des stock perps Bitget par rapport aux Futures crypto
Les stock perps fusionnent des actifs financiers traditionnels avec des dérivés crypto, offrant des avantages clairs sur plusieurs dimensions. Ils conviennent particulièrement aux utilisateurs avec un appétit de risque modéré ou aux investisseurs cherchant à se diversifier face à la forte volatilité de la crypto.
| Dimension |
Perps actions Bitget (actions américaines, Futures perpétuels) |
Futures crypto Bitget (crypto comme BTC/ETH, Futures perpétuels) |
Pourquoi les stock perps ont l’avantage |
| Volatilité sous-jacente |
Faible à moyenne (mouvements quotidiens de 1–5 %, parfois plus élevés pour des valeurs comme NVDA) |
Extrêmement élevée (mouvements quotidiens de BTC de 5–15 % ; cela peut dépasser 20 % dans des conditions extrêmes) |
Les actions américaines connaissent moins de flash crash et sont davantage guidées par les fondamentaux, ce qui réduit le risque de liquidations de type cygne noir. |
| Flash crash / mouvements extrêmes |
Risque plus faible (les prix sont plus stables grâce aux marchés réglementés et à l’agrégation d’indices multi-sources) |
Risque plus élevé (les marchés décentralisés sont vulnérables aux gros ordres et à la manipulation) |
Les Perps actions utilisent un indice composite provenant de multiples sources tokenisées pour une découverte des prix plus équitable, rendant les flash crash beaucoup moins probables que sur la crypto. |
| Effet de levier |
Jusqu’à 100x sur les actions populaires, 10–25x sur les indices |
Jusqu’à 125x (pour les principales cryptos comme BTC) |
Un effet de levier modéré amplifie les gains tout en maîtrisant le risque excessif, ce qui le rend plus adapté pour faire croître des positions de manière régulière. |
| Taux de financement / coût de détention |
Généralement plus bas (selon le ratio long/short), stable sur certaines périodes |
Très volatile (les détenteurs de positions long paient souvent des frais élevés en marché haussier) |
Un coût de détention plus prévisible à long terme, réduisant le risque d’érosion des profits due aux frais de financement. |
| Frais de transaction |
Ultra-faibles (les frais maker peuvent être de 0 %, les frais taker aussi bas que 0.0065 %, avec de nombreux avantages à durée limitée) |
Standard à 0.02 % pour les ordres maker et 0.06 % pour les ordres taker |
Des coûts de transaction nettement plus bas signifient que vous pouvez ouvrir des positions plus importantes ou trader plus fréquemment avec le même capital. |
| Niveau de risque global |
Relativement plus faible (soutenu par les fondamentaux des actions et une volatilité moindre) |
Plus élevé (porté par la pure spéculation et une forte volatilité) |
Bien que l’effet de levier amplifie les gains, la probabilité de liquidation est plus faible, ce qui convient aux stratégies de moyen à long terme. |
| Diversification et couverture |
Se combine facilement avec des portefeuilles crypto pour réduire le risque lié à un seul actif |
Fortement corrélés (la plupart des cryptos évoluent avec BTC) |
Offrent une exposition directe à la finance traditionnelle, permettant une véritable diversification des actifs. |
| Utilisateurs cibles |
Utilisateurs crypto avec un appétit de risque moyen qui veulent une exposition aux actions américaines tout en évitant une forte volatilité |
Joueurs crypto purs avec une tolérance au risque élevée recherchant des rendements maximum |
Un pont vers les marchés traditionnels plus accessible et plus stable, réduisant la probabilité que les nouveaux traders perdent la totalité de leur investissement. |
En résumé, les stock perps Bitget conservent la flexibilité du trading crypto (effet de levier, règlement en USDT, mode de couverture) tout en réduisant significativement la volatilité et les risques extrêmes. Ils servent de pont idéal pour les utilisateurs crypto souhaitant passer au niveau supérieur dans la finance traditionnelle.
Trader des Perps actions vs. des Futures crypto : cas d’utilisation
Supposons qu’un utilisateur dispose de 1000 USDT et utilise un effet de levier de 10x sur Bitget, avec l’objectif de conserver la position pendant une semaine. Cet exemple simplifié (hors frais/taux de financement pour l’illustration) montre la différence potentielle en termes de résultat et de risques.
Scénario 1 : Prendre une position long sur une action tech (NVDA)
-
Perps actions : Supposons que NVDA augmente de 8 % en une semaine (un mouvement typique post-résultats). Avec un effet de levier de 10x, le profit est d’environ 80 %. Les 1000 USDT deviennent 1800 USDT. La volatilité est modérée avec quasiment aucun flash crash, offrant une tranquillité d’esprit et un risque de liquidation très faible.
-
Futures crypto : Supposons que BTC augmente de 8 % dans le même contexte haussier. Le profit théorique est aussi de 80 % avec 10x de levier. Cependant, BTC enregistre souvent des retracements de 10–15 %. La position pourrait facilement être liquidée ou partiellement liquidée en cours de route, ce qui peut vous faire perdre le capital même si la direction finale est correcte.
Scénario 2 : Volatilité de marché extrême (nouvelles négatives)
-
Perps actions : Le marché baisse de 4 % sur une journée à la suite de commentaires de la Fed. Avec un levier de 10x, la perte est de 40 %, il reste 600 USDT en solde. Les actions américaines chutent rarement de plus de 10 % en une seule séance et ont tendance à rebondir, avec moins de liquidations en cascade.
-
Futures crypto : Avec le même levier de 10x, un flash crash de 10 % (fréquent en crypto) entraînerait une perte de 100 %, anéantissant le compte.
Ces exemples montrent que les Perps actions permettent d’utiliser l’effet de levier pour amplifier les gains sans amplifier le risque de ruine. C’est particulièrement précieux pendant la saison des résultats ou lors d’événements macro, vous permettant de capter de l’Alpha sur les marchés actions américains tout en évitant les lessivages brutaux typiques de la crypto.
Pour qui les Perps actions Bitget sont-ils les plus adaptés ?
1. Investisseurs haussiers ou baissiers sur les actions américaines sans compte traditionnel : Vous pouvez trader des mouvements directionnels sur des actions populaires comme Apple, Tesla, Nvidia et Coinbase directement avec les USDT dans votre Portefeuille crypto, en vous affranchissant des contraintes des comptes de courtage traditionnels, des transferts transfrontaliers et des restrictions géographiques.
2. Natives crypto familiers des Futures crypto et des marchés 24h/24, 7j/7 : L’interface de trading, les types d’ordres (ordres à cours limité, au marché et conditionnels), l’ajustement du levier, la gestion des positions et la mécanique du funding reflètent étroitement les Futures perpétuels BTC/USDT ou ETH/USDT. Pour les traders crypto expérimentés, la courbe d’apprentissage est inexistante, et les horaires de trading constituent un énorme progrès par rapport aux heures de marché traditionnelles.
3. Traders agressifs/spéculatifs recherchant un fort effet de levier : Avec un levier bien supérieur à la marge de 2–4x offerte par les courtiers actions traditionnels, c’est idéal pour utiliser un petit capital afin de capter de grandes hausses (comme sur Tesla ou Nvidia) ou pour prendre de grosses positions short sur des valeurs tech surévaluées. Notez que cela implique également un risque extrêmement élevé et ne convient qu’aux utilisateurs ayant une tolérance au risque élevée.
4. Traders hybrides actifs à la fois sur la crypto et les actions : Un seul compte Bitget et un seul pool de capital en USDT vous permettent de passer en toute fluidité entre les Futures crypto et les Perps actions. Cela maximise l’efficacité du capital et la vitesse d’exécution, en particulier pour ceux qui rééquilibrent fréquemment ou recherchent des couvertures entre marchés.
5. Traders professionnels ou semi-professionnels recherchant un accès 24h/24 à faible barrière : Cela inclut ceux qui cherchent à couvrir des portefeuilles crypto, à spéculer sur des actions/indices tech ou à faire tourner des bots grille/quantitatifs. La plateforme prend en charge les graphiques TradingView, des API et des outils professionnels comme les ordres TP/SL.
Conclusion
Si vous êtes un vétéran de la crypto, lassé des explosions de volatilité mais souhaitant toujours participer à la croissance des meilleures entreprises mondiales (comme Apple, Tesla, Nvidia), les Perps actions Bitget sont un excellent choix. Ils combinent le meilleur des deux mondes — effet de levier, accès 24h/24 et faibles barrières — tout en réduisant significativement le FOMO propre à la crypto.
Le trading comporte des risques importants. Commencez avec de petits montants, utilisez un faible effet de levier, placez toujours des TP/SL et tradez de manière responsable. N’hésitez pas à essayer sur Bitget !
OpenEden est une plateforme basée sur la blockchain, spécialisée dans la tokenisation d'actifs du monde réel, qui permet d'intégrer des actifs tangibles tels que les bons du Trésor américain sur la blockchain de manière régulée, sécurisée et accessible. Fondé par Jeremy Ng en 2022 et bénéficiant du soutien d'YZi Labs ainsi que d'un financement de 5 millions de dollars, OpenEden (EDEN) va bientôt listé sur Bitget !
Qu'est-ce qu'OpenEden (EDEN) ?
OpenEden est une plateforme de tokenisation d'actifs du monde réel qui convertit des produits financiers traditionnels, tels que les bons et obligations gouvernementales, en tokens numériques sur la blockchain. Parmi ses produits phares figurent les TBILL (bons du Trésor américain tokenisés) et l'USDO (stablecoin porteur de rendement), permettant aux utilisateurs d'accéder à des actifs financiers de qualité institutionnelle grâce à la technologie blockchain.

La plateforme permet de faciliter l'accès aux marchés mondiaux, de réduire les contraintes de liquidité, d'optimiser les processus de règlement et de minimiser les frictions réglementaires auxquelles sont confrontés les actifs traditionnels. OpenEden permet la propriété fractionnée et le transfert fluide sur la blockchain, tout en offrant une plateforme régulée et transparente qui garantit aux utilisateurs une gestion d'actifs en toute confiance.
Innovation clé : OpenEden utilise la blockchain pour tokeniser des actifs du monde réel, c'est‑à‑dire convertir ces actifs en tokens numériques représentant une propriété ou des droits. Cela permet d'investir, de trader et de gérer des produits financiers traditionnels directement on‑chain avec transparence et efficacité.
Qui a créé OpenEden (EDEN) ?
OpenEden a été fondé en 2022 par Jeremy Ng, un dirigeant expérimenté issu à la fois de la finance traditionnelle et du secteur crypto.

Jeremy Ng (fondateur et PDG) :
● Ancien directeur général et responsable de la région APAC chez Gemini
● Ancien PDG de Leonteq Asia
● Ancien responsable des produits dérivés de la division FICC chez Goldman Sachs
● Anciens postes chez Deutsche Bank et Morgan Stanley
● Titulaire du CFA
Membres clés de l'équipe :
● Duke Du (CTO) : dirige le développement technique, exploitant son expérience en fintech et organisations blockchain
● Wayne Tan (directeur juridique) : responsable de la conformité juridique et réglementaire, ancien collaborateur chez OKX et Bybit
● Frederick Chng (responsable produit) : supervise la stratégie et le développement produit
L'équipe cumule des décennies d'expérience chez Goldman Sachs, Morgan Stanley, Deutsche Bank, Gemini, OKX, Bybit, SEA, Accenture et BlockFi, combinant expertise en finance institutionnelle et capacités de développement blockchain.
Quels investisseurs soutiennent OpenEden (EDEN) ?
OpenEden a levé 5 millions de dollars au cours de plusieurs cycles de financement auprès d'investisseurs en crypto et en finance, complétés par des partenariats institutionnels supplémentaires.
Cycles de financement :
● Mai 2023 : 5 millions de dollars levés
● Septembre 2024 : financement stratégique (montant non divulgué)
Principaux investisseurs en capital-risque :
● YZi Labs (anciennement Binance Labs) : investisseur de premier plan en phase de démarrage et partenaire stratégique
● UXD Protocol : investisseur et partenaire de l'écosystème
Partenariats institutionnels :
● Bank of New York Mellon (BNY) : gestionnaire d'investissement principal et dépositaire des fonds de bons du Trésor américain tokenisés d'OpenEden, fournissant des services de garde et de gestion de niveau institutionnel
Le soutien financier apporté par YZi Labs et le partenariat institutionnel avec BNY Mellon témoignent d'une grande confiance dans l'approche réglementée d'OpenEden en matière de tokenisation d'actifs du monde réel.
Comment fonctionne OpenEden (EDEN) ?
OpenEden permet d'accéder et d'investir dans des produits financiers du monde réel via des tokens sur la blockchain, tout en maintenant des standards élevés de conformité et de sécurité.
Processus de tokenisation des actifs
OpenEden acquiert des actifs traditionnels comme des bons du Trésor américain et les conserve en sécurité auprès de banques ou de dépositaires de confiance. Pour chaque actif réel détenu, OpenEden émet un token numérique sur des réseaux blockchain. Chaque token est adossé à un actif selon un ratio de 1:1 et fait l'objet d'audits réguliers attestant que les actifs réels sont bien détenus en réserve.
Infrastructure de contrats intelligents
La plateforme utilise des contrats intelligents sur des blockchains pour gérer automatiquement la création, le rachat et le transfert de tokens, rendant les processus rapides, transparents et peu coûteux. Ces programmes fonctionnent sur des blockchains avec des règles transparentes et une exécution automatisée.
Prise en charge multi-chaînes
OpenEden opère sur Ethereum et s'étend à Arbitrum, Base, Solana, BNB Chain et XRP Ledger. Cela offre de la flexibilité et des frais plus faibles sur différents réseaux, permettant aux utilisateurs de choisir leur environnement blockchain préféré.
Preuve de réserves et sécurité
Des partenaires indépendants et le protocole publient régulièrement des preuves démontrant que chaque token est entièrement adossé à des actifs du monde réel via des audits et des données blockchain. Ces actifs sont protégés par des institutions réglementées comme BNY Mellon via une garde de fonds de qualité institutionnelle plutôt que par un simple stockage géré par la société elle-même.
Interopérabilité inter‑chaînes
L'intégration au CCIP de Chainlink permet des données de preuve de réserves inter‑chaînes, une tarification on‑chain des stablecoins et des mouvements de tokens fluides entre les blockchains intégrées.
Vous pouvez accéder à la plateforme sur openeden.com.
Tokenomique d'OpenEden (EDEN)
Le token EDEN est l'actif numérique natif de l'écosystème OpenEden, permettant la gouvernance, le staking et la participation à l'écosystème.
Détails du token
● Nom du token : OpenEden
● Symbole du token : EDEN
● Offre totale : 1 000 000 000 tokens (1 milliard)
● Blockchains : ERC‑20 (Ethereum), avec des déploiements sur Arbitrum, Solana, Base, BNB Chain et XRPL
● Adresse du contrat sur Ethereum : 0x7c2a792acafcfc9dece3396e2119ccd036bab182
Distribution des tokens
● Écosystème : 30,22% – 100% distribués lors du TGE
● Équipe & conseillers : 20% – 5% distribués lors du TGE, période de blocage de 6 mois, puis acquisition linéaire sur 24 mois
● Investisseurs : 15,28% – 5% distribués lors du TGE, période de blocage de 6 mois, puis acquisition linéaire sur 24 mois
● Trésorerie : 15% – 50% distribués lors du TGE, période de blocage de 6 mois pour le reste
● Partenaires : 10 % – 81,25% distribués lors du TGE, puis 25% débloqués chaque mois, avec pénalité en cas de retrait anticipé
● Campagne d'airdrop : 9,5% – 25% distribués lors du TGE, puis 25% débloqués chaque mois, avec pénalité en cas de retrait anticipé
Structure d'acquisition : les tokens de l'équipe, des conseillers et des investisseurs incluent des calendriers d'acquisition sur plusieurs années afin d'assurer l'alignement à long terme du protocole et d'éviter une pression vendeuse soudaine.
Utilités du token
● Gouvernance : votez sur les mises à niveau du protocole, les structures de frais et les décisions de l'écosystème
● Staking : stakez des tokens EDEN pour contribuer à la sécurisation du réseau et gagner des récompenses de plateforme
● Récompenses de l’écosystème : gagnez des incitations pour la fourniture de liquidité, l’adoption précoce et la participation communautaire
● Réductions de frais : bénéficiez de frais réduits et d'accès à des fonctionnalités premium
● Composabilité DeFi : utilisez le token comme collatéral dans des pools de liquidité et des stratégies génératrices de rendement sur des protocoles partenaires
Pourquoi OpenEden ?
Les actifs traditionnels du monde réel sont confrontés à des obstacles importants en matière d'accessibilité et de liquidité. OpenEden répond à ces défis avec plusieurs avantages :
Direction expérimentée : fondé par Jeremy Ng, passé par Gemini, Goldman Sachs, Morgan Stanley et Deutsche Bank, combinant expertise en finance institutionnelle et connaissance du secteur crypto.
Partenariat institutionnel : BNY Mellon agit comme gestionnaire d'investissement et dépositaire principal, offrant une sécurité et une gestion de qualité institutionnelle pour les actifs tokenisés.
Validation par le financement : les 5 millions de dollars levés auprès de YZi Labs et UXD Protocol témoignent de la confiance du capital-risque dans la tokenisation réglementée d'actifs du monde réel.
Infrastructure multi-chaînes : compatibilité native avec Ethereum, Arbitrum, Base, Solana, BNB Chain et XRP Ledger, assurant une large accessibilité et une interopérabilité inter‑chaînes.
Partenariats clés : collaborations avec Chainlink pour l'interopérabilité inter‑chaînes, Curve et Balancer pour l'intégration DeFi, Ceffu et Anchorage pour les solutions de garde de fonds, et Bake pour l'accès des particuliers.
Approche réglementée : une plateforme privilégiant la conformité, avec une garde transparente, une preuve de réserves et le respect des réglementations, qui inspire une certaine confiance aux utilisateurs et aux institutions.
Intégration DeFi : des tokens conçus pour une intégration aisée aux principaux protocoles DeFi comme Curve, Balancer, Euler, Pendle et ZeroLend pour le prêt, l'emprunt et les opportunités de rendement.
Produits à rendement réel : les tokens TBILL et USDO offrent des rendements réels provenant des bons du Trésor américain plutôt que des émissions inflationnistes de tokens, créant ainsi une valeur durable.
La plateforme établit un pont entre la finance traditionnelle et la technologie blockchain, rendant des produits financiers de niveau institutionnel accessibles aux utilisateurs du monde entier tout en préservant la traçabilité et la sécurité.

OpenEden (EDEN) est désormais disponible sur Bitget
Nous sommes ravis d'annoncer qu'OpenEden (EDEN) va être listé dans les zones Innovation et RWA. Voici les détails complets :
Début du trading : 30 septembre 2025 à 13h00 (UTC+2)
Tradez EDEN/USDT sur Bitget !
Avertissement : Les opinions exprimées dans cet article le sont à titre informatif uniquement. Cet article ne constitue pas une recommandation des produits et services présentés, ni un conseil en matière d'investissement, de finance ou de trading. Il convient de consulter des professionnels qualifiés avant de prendre toute décision financière.
Introduction
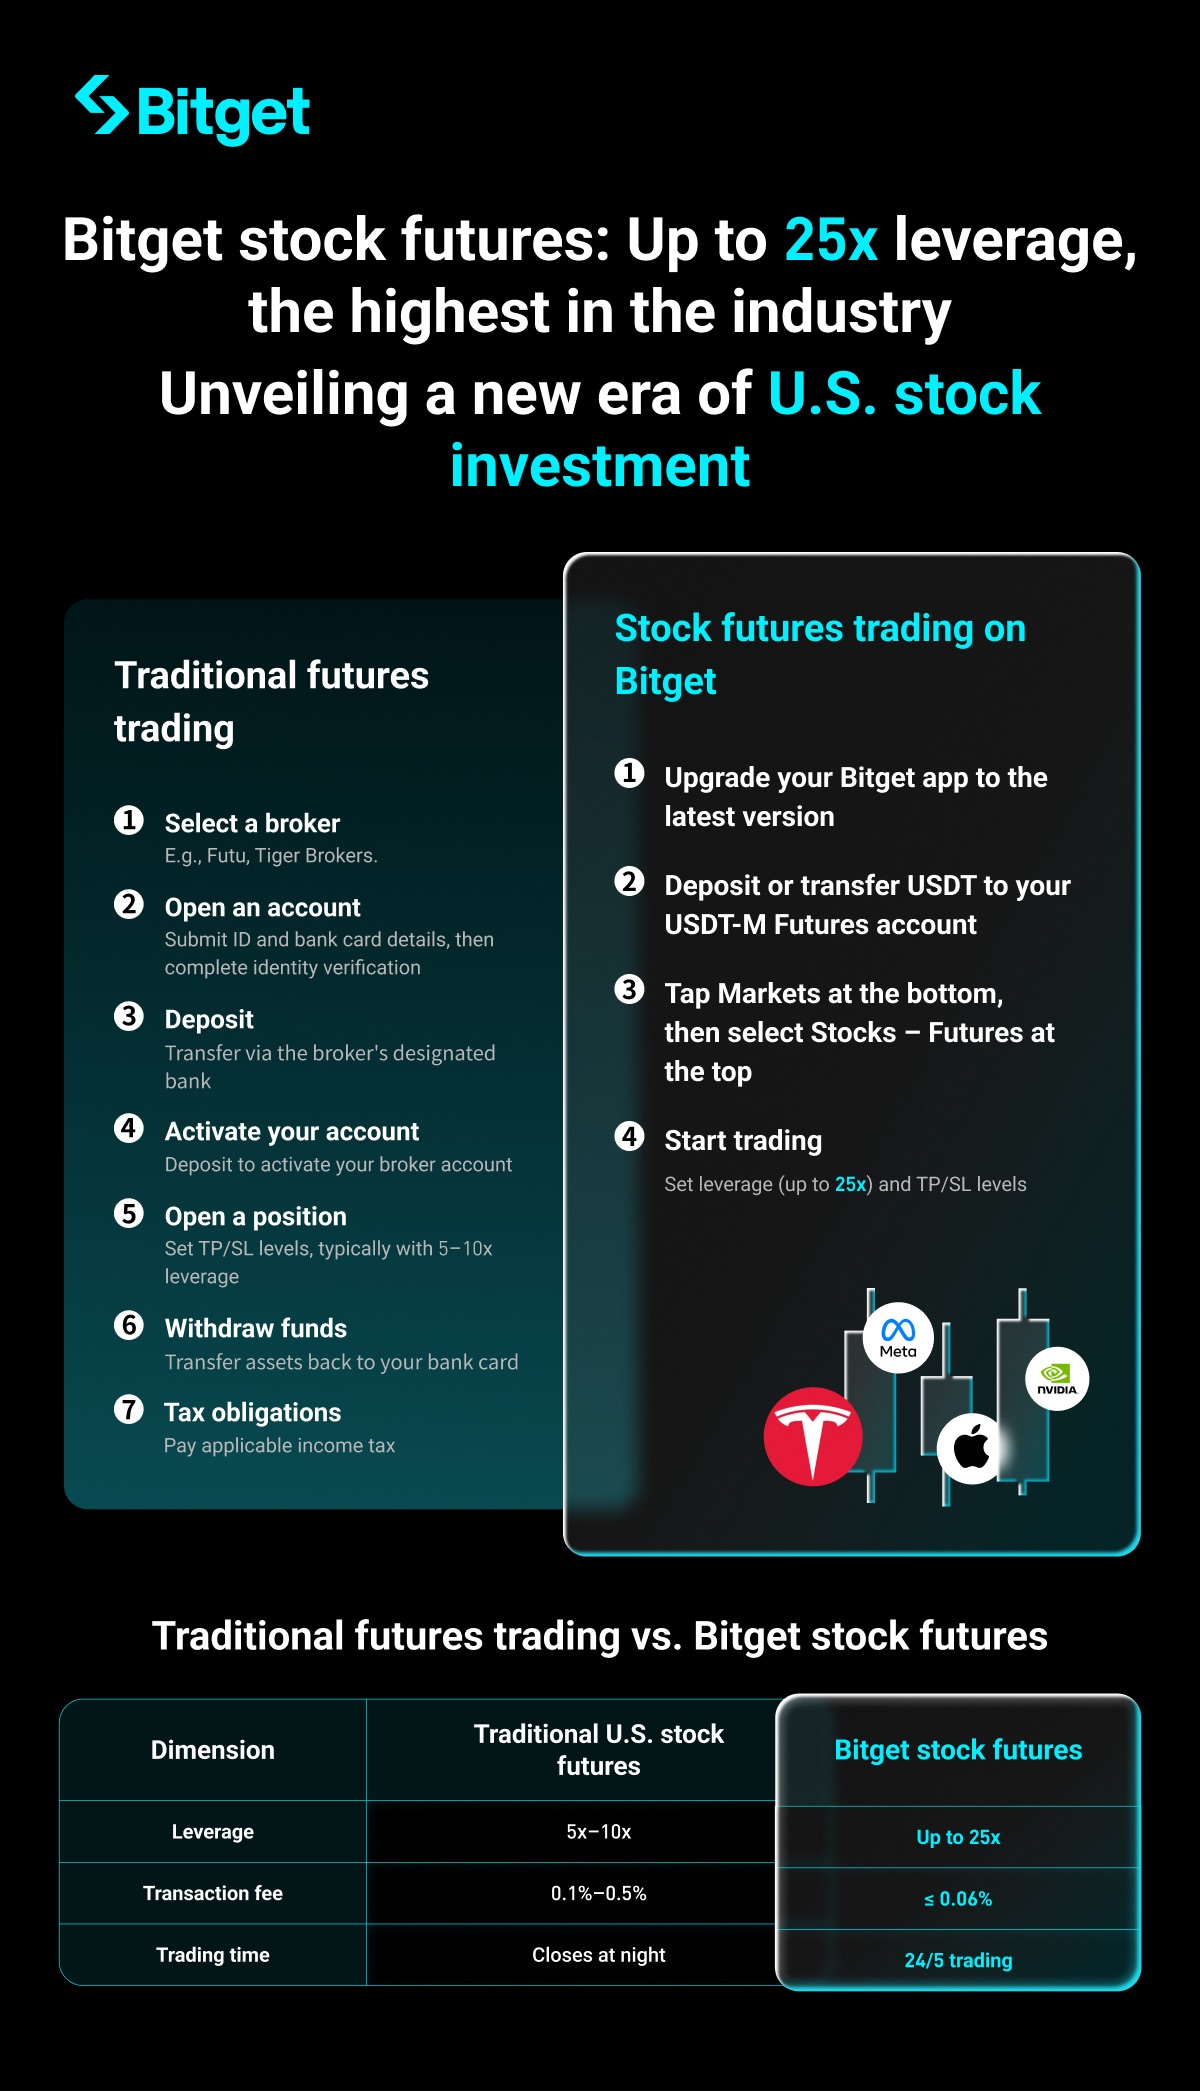
En tant que plateforme de trading crypto de premier plan, Bitget a récemment lancé 25 Futures perpétuels USDT-M sur actions américaines, avec un effet de levier pouvant atteindre 25x. Ce produit innovant permet aux utilisateurs de trader des actions américaines avec règlement en USDT, sans détenir directement les actifs d'actions sous-jacents. Par rapport aux Futures sur actions US traditionnels, les Futures sur actions US Bitget offrent des avantages évidents en termes d'effet de levier, de frais de transaction et d'horaires de trading. Cet article présente les Futures sur actions US Bitget : définition, caractéristiques, actifs pris en charge, guide de trading, gestion des risques et points clés pour trader en toute sécurité.
Que sont les Futures sur actions ?
Les Futures sur actions sont un indice de Futures perpétuels innovant pour des actifs d'actions proposés par Bitget. Ses actifs sous-jacents sont des indices d'actions tokenisées déjà en circulation sur le marché. Chaque indice inclut au moins une action tokenisée, pouvant provenir de différents émetteurs. Bitget définit et publie les pondérations en fonction des parts de marché et de la liquidité. Par exemple, le prix de l'indice des Futures NVDAUSDT peut être calculé à partir d'un indice composite regroupant des actions NVDA tokenisées (RWA) émises par xStock, ONDO et d'autres sociétés :
Bitget ajoute ou supprime des tokens ou des marchés de trading selon des facteurs tels que l'activité de marché et le volume de trading, en mettant à jour les sources de l'indice. Cela rend les prix des Futures plus transparents et stables. Au lieu de suivre directement les actifs d'actions sous-jacents, ils servent à mesurer les prix des actions tokenisées.
Futures traditionnels et Futures sur actions US Bitget
Les Futures sur actions US Bitget surpassent les Futures sur actions US traditionnels de bien des manières :
Différences entre les Futures sur actions US Bitget et les Futures perpétuels USDT-M classiques
Les Futures sur actions US Bitget sont conçus pour être différents des Futures perpétuels USDT classiques. Voici quelques comparaisons clés :
| Caractéristique |
Futures sur actions |
Futures perpétuels USDT classiques |
| Période de trading |
24h/5j : du lundi à 05h00 au samedi à 05h00 (UTC+1), avec des suspensions ponctuelles annoncées à l'avance. |
24h/24, 7j/7 |
| Devise de règlement |
USDT |
USDT |
| Devise de cotation |
USDT |
USDT |
| Actif sous-jacent |
Indice composite d'actifs tokenisés émis sur plusieurs plateformes (indice multi-tokens) |
Un seul token désigné |
| Mode de position |
Uniquement en mode marge isolée |
Marge isolée, marge croisée et compte de trading unifié |
| Effet de levier max. |
25x |
125x |
| Prix de l'indice |
Indice composite des prix de tokens issus de marchés tels que xStock et ONDO |
Prix Spot du token désigné |
| Prix de référence |
Méthode standard |
Méthode standard |
| Limites d'intérêt ouvert (OI) |
Des limites OI individuelles et à l'échelle de la plateforme s'appliquent |
Limites OI individuelles uniquement |
| Taux de financement |
4h |
Toutes les 1h, 2h, 4h ou 8h |
Avantages des Futures sur actions US Bitget
Les principaux avantages des Futures sur actions US Bitget résident dans leur innovation et leur conception ergonomique :
1. Une première mondiale : des Futures sur indice d'actions tokenisées, les premiers du secteur, adossés à plusieurs sources de prix pour renforcer la transparence et la sécurité.
2. Effet de levier élevé : jusqu'à 25x d'effet de levier pour maximiser les profits potentiels et améliorer l'utilisation du capital.
3. Actifs sous-jacents diversifiés : plus de 20 actions américaines populaires sont prises en charge pour permettre différentes stratégies de trading.
4. Frais de transaction réduits : les taux de frais ne dépassent pas 0,06%, réduisant les coûts pour les traders haute fréquence.
5. Calcul de l'indice : sur la base des prix en USDT des actifs tokenisés de différents émetteurs (par exemple, xStock, ONDO), les pondérations sont recalculées régulièrement ou à chaque fois que des événements majeurs se produisent, ce qui permet à l'indice de suivre l'évolution du marché.
Rééquilibrage de l'indice
● Rééquilibrage régulier : les composants de l'indice et leurs pondérations sont rééquilibrés quotidiennement à 21h01 (UTC+1).
● Ajustement spécial : si des composants subissent des changements importants (tels que le délisting, le manque de liquidité ou une volatilité extrême), ils seront supprimés, les pondérations seront recalculées et un composant de substitution sera utilisé.
● Hard fork/airdrop/ajustements : aucun ajustement n'est nécessaire pour les forks qui ne génèrent pas de nouveaux tokens. Si de nouveaux tokens sont générés, ils seront inclus avec la pondération d'origine. S'ils ne répondent pas aux critères, ils seront supprimés lors du prochain rééquilibrage. En cas de split ou de merge des tokens, le composant d'origine sera remplacé par le nouveau token et la pondération sera ajustée en conséquence.
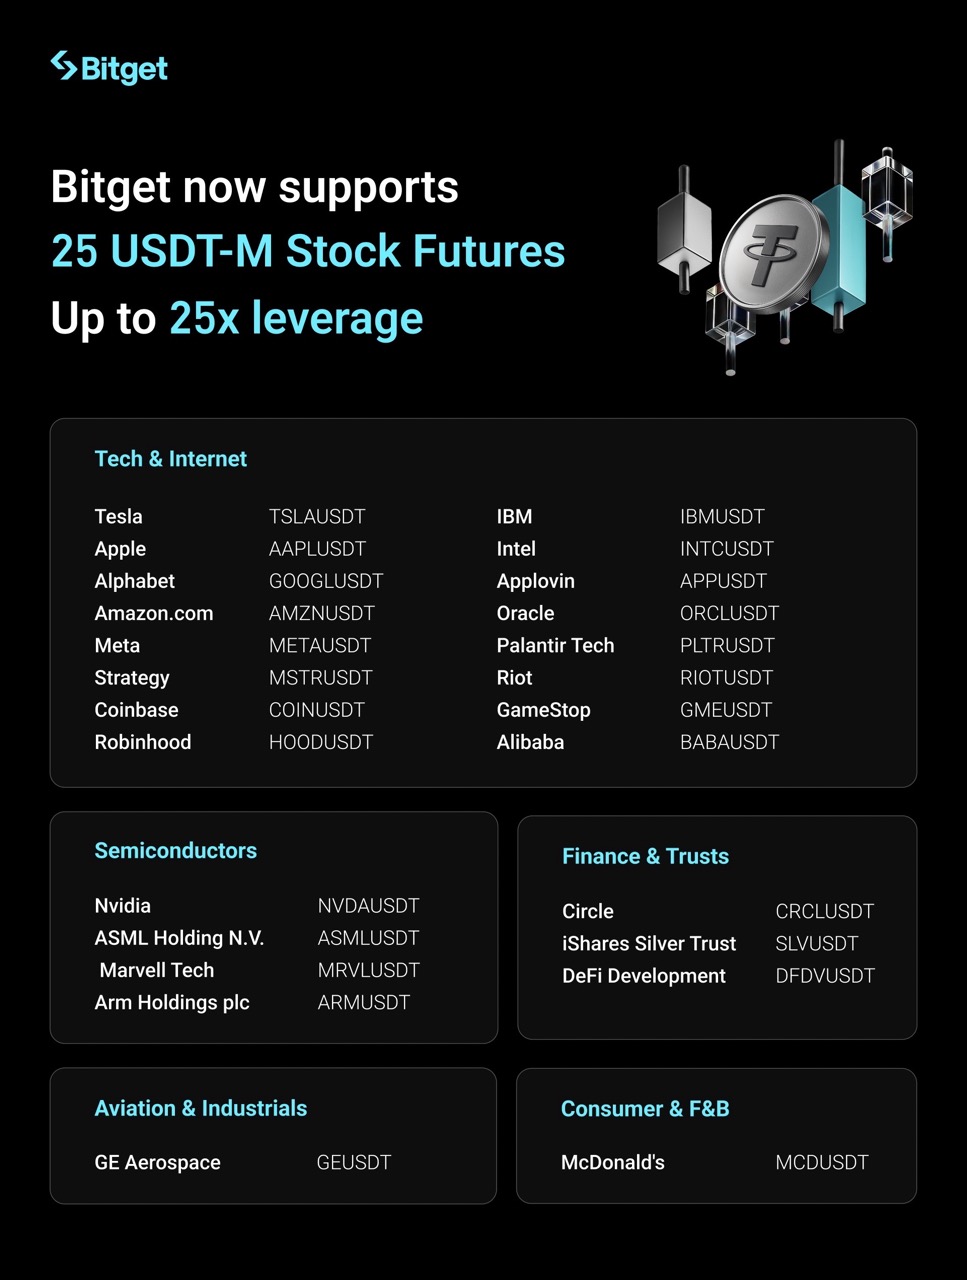
Détails des Futures sur actions US disponibles sur Bitget
Bitget prend actuellement en charge 25 Futures perpétuels USDT-M sur actions US en vogue, regroupés par société :
Comment trader des Futures sur actions US via Bitget ?
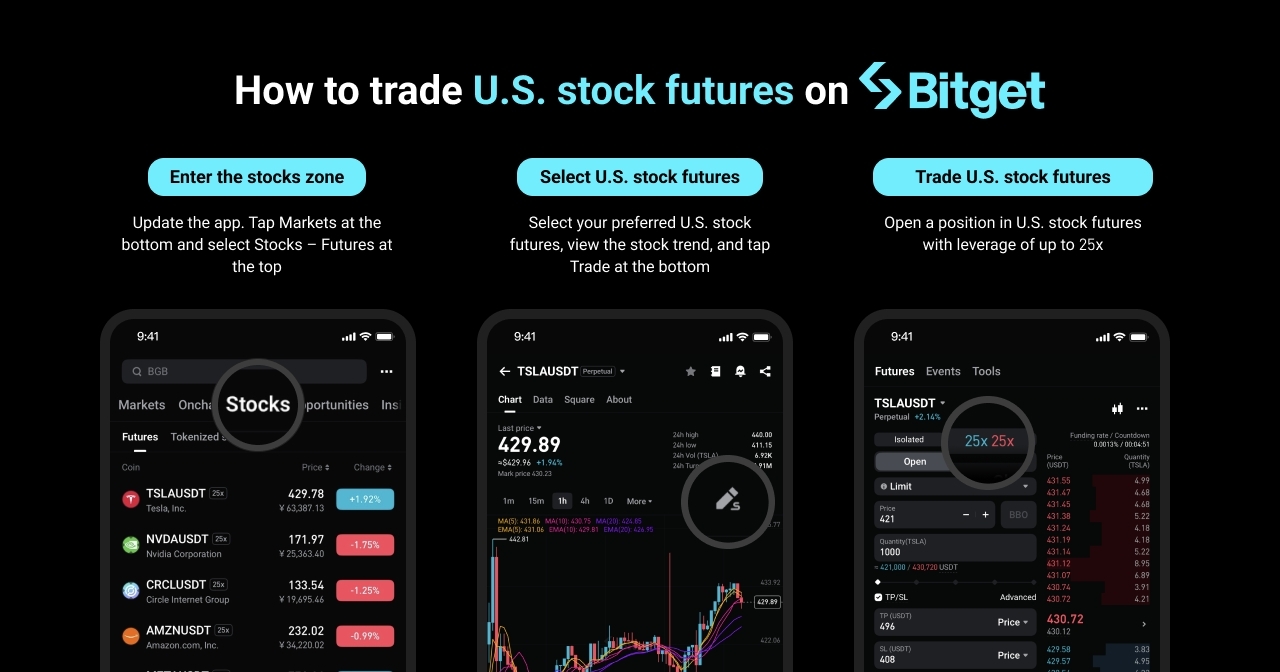
1. Mettre à jour l'application : assurez-vous d'utiliser la dernière version de l'application Bitget ou visitez le site officiel.
2. Ajouter des fonds : déposez ou transférez des USDT vers votre compte Futures USDT-M.
3. Accéder à la page de trading : appuyez sur Marchés en bas, puis sélectionnez Actions – Futures en haut. Recherchez par symbole ou parcourez les catégories d'actions.
4. Commencer à trader : définissez l'effet de levier (pouvant aller jusqu'à 25x), le TP/SL, et d'autres paramètres. Il est possible de trader sur le site web, l'application et via l'API, mais pas en mode compte de trading unifié. Vous devez passer en mode mono-actif.
5. Pendant la suspension du trading : vous pouvez annuler les ordres existants mais vous ne pourrez pas en placer de nouveaux. Les frais de financement ne seront pas réglés, le prix de référence ne sera pas mis à jour et les positions ne seront pas liquidées.
Horaires de trading et jours fériés
● Horaires de trading habituels : le trading est disponible 24 heures sur 24, 5 jours par semaine, du dimanche à 21h00 au vendredi à 21h00 (UTC+1).
● Suspension : le trading sera suspendu les jours fériés, lorsque les marchés financiers sont fermés. Les principales dates de fermeture pour 2025 sont les suivantes :
| Date |
Jour |
Nom |
Statut du trading |
| 01/01/2025 |
Mercredi |
Jour de l'An |
Fermé toute la journée |
| 20 janvier 2025 |
Lundi |
Martin Luther King Jr. Day |
Fermé toute la journée |
| 17 février 2025 |
Lundi |
President's Day |
Fermé toute la journée |
| 18 avril 2025 |
Vendredi |
Good Friday |
Fermé toute la journée |
| 26 mai 2025 |
Lundi |
Memorial Day |
Fermé toute la journée |
| 19 juin 2025 |
Jeudi |
Juneteenth |
Fermé toute la journée |
| 4 juillet 2025 |
Vendredi |
Independence Day |
Fermé toute la journée |
| 1er septembre 2025 |
Lundi |
Labor Day |
Fermé toute la journée |
| 27 novembre 2025 |
Jeudi |
Thanksgiving Day |
Fermé toute la journée |
| 25 décembre 2025 |
Jeudi |
Noël |
Fermé toute la journée |
● Fermetures anticipées : le marché fermera de manière anticipée à 19h00 (UTC+2) le 3 juillet 2025 (veille de l'Independence Day), le 28 novembre 2025 (lendemain de Thanksgiving) et le 24 décembre 2025 (Réveillon de Noël).
● Remarque : le prix d'ouverture peut différer sensiblement du prix de clôture de la veille. Veuillez évaluer les risques si vous conservez des positions pendant la nuit.
Gestion des risques et rappels
Mécanisme de liquidation
● Identique aux Futures classiques à marge isolée, le risque étant déterminé par le prix de liquidation ou le taux de marge de la position.
● Pendant la suspension des marchés, les positions ne seront pas liquidées. Toutefois, s'il existe un écart de prix à la reprise du trading, cela peut entraîner une liquidation. Il est recommandé d'ajouter une marge supplémentaire avant l'ouverture du marché.
Fonds d'assurance
● L'ADL est activé par défaut pour chaque paire de trading de Futures, avec 50 000 USDT injectés comme fonds de risque initial.
● Déclenchement de l'ADL : activé lorsque les fonds propres du fonds d'assurance tombent à 0.
Avertissement sur les risques
● Les Futures perpétuels sur actions US peuvent connaître une forte volatilité. Trader avec un effet de levier élevé peut augmenter considérablement votre exposition au risque. Gérez vos positions avec discernement.
● Ce produit n'est pas un titre financier et ne représente pas la propriété de l'action sous-jacente. Aucun dividende, intérêt ni droits de vote ne s'appliquent.
● Ce produit n'est couvert par aucune assurance ou garantie gouvernementale. Bitget n'est ni l'émetteur ni le distributeur.
● Les actifs numériques sont très volatils. N'investissez que ce que vous pouvez vous permettre de perdre. Les performances passées ne garantissent pas les résultats futurs. Bitget ne pourra pas être tenu responsable des pertes éventuelles.
● Vous devriez toujours faire appel à des conseillers financiers indépendants et consulter les Conditions d'utilisation de Bitget et l'Accord des services Futures.
● Bitget peut modifier certains paramètres, tels que l'effet de levier et le taux de marge, en fonction des conditions de marché. Consultez les dernières annonces officielles.
Bitget continuera d'améliorer ses produits afin d'offrir des services de trading professionnels et sécurisés. Pour toute assistance, visitez le Centre d'aide Bitget ou contactez le service client. Merci pour votre confiance !
Avertissement sur les risques :
Les tokens d'actions (le "Produit") sont basés sur un ensemble d'indices d'actions tokenisées déjà en circulation sur le marché. Toutefois, le Produit n'est pas un titre et ne représente pas la propriété effective des actions sous-jacentes, des tokens d'actions correspondants ou des indices. Le Produit ne vous donne droit à aucun dividende, intérêt, droit de vote, droit d'actionnaire ni à aucune opération sur droits préférentiels de souscription (y compris, sans s'y limiter, les fractionnements d'actions, les scissions ou les droits de souscription) portant sur les actions sous-jacentes, les tokens d'actions correspondants ou les indices. Ce produit n'est ni garanti, ni approuvé, ni soutenu par un gouvernement ou une institution quelconque. Bitget n'est ni l'émetteur ni le distributeur des actions sous-jacentes, des tokens d'actions correspondants ou des indices.
Les prix des actifs numériques sont extrêmement volatils et peuvent fluctuer de manière significative. N'investissez que des fonds que vous pouvez vous permettre de perdre. La valeur de votre investissement peut évoluer et il n'y a aucune garantie de réaliser vos objectifs financiers ou de récupérer votre capital. Nous vous conseillons de consulter un conseiller financier indépendant et d'évaluer attentivement votre expérience et votre situation financière. Les performances passées ne garantissent pas les résultats futurs. Bitget décline toute responsabilité en cas de pertes éventuelles. Rien dans cet article ne constitue un conseil financier. Pour plus d'informations, veuillez consulter nos Conditions d'utilisation et l'Accord des services Futures.
Avertissement sur les risques
Avec un simple compte Bitget, vous pouvez trader simultanément des actions et des cryptomonnaies.
Participer maintenantFAQ
Quel est le cours de l'action Archer Daniels Midland ?
Quel est le symbole boursier de Archer Daniels Midland ?
Quelles sont les prévisions pour les actions ADM ?
Quelle est la capitalisation boursière de Archer Daniels Midland ?
Qu'est-ce que le ratio P/E (sur 12 mois) ?
Le ratio P/E (sur 12 mois) correspond au ratio prix-bénéfice sur les douze derniers mois. Il s'agit d'un indicateur de valorisation historique calculé à partir du bénéfice par action (BPA) d'une entreprise au cours des douze derniers mois consécutifs, reflétant ainsi la rentabilité passée de la société.
Le ratio P/E mesure le rapport entre le prix d'une action et la rentabilité d'une entreprise, et sert souvent de base pour déterminer si une action est "bon marché" ou "chère".
Ratio P/E = prix du marché (P) ÷ bénéfice par action (BPA), ou ratio P/E = capitalisation boursière totale ÷ profit net profit attribuable aux actionnaires
L'interprétation du ratio P/E (sur 12 mois) doit toujours être considérée conjointement avec d'autres facteurs et est principalement utilisée à des fins de comparaison des valorisations plutôt que comme indicateur unique.
- Un ratio P/E (sur 12 mois) plus faible signifie que les investisseurs paient moins pour chaque unité de bénéfice. Cela peut indiquer que l'action est sous-évaluée, ou que le marché a des attentes limitées quant à la croissance future de l'entreprise, comme c'est le cas dans les secteurs matures ou à croissance lente.
- Un ratio P/E (sur 12 mois) plus élevé signifie que les investisseurs paient plus cher chaque unité de bénéfice. Cela reflète souvent des attentes de forte croissance des bénéfices futurs, ce qui est courant pour les actions de croissance ou technologiques, bien que cela puisse également suggérer que l'action est surévaluée.
- Comparaison avec les pairs : comparez le P/E (sur 12 mois) de l'entreprise avec le P/E moyen ou médian d'autres sociétés du même secteur. Un P/E nettement plus élevé peut nécessiter une analyse approfondie afin de déterminer si la valorisation élevée de l'entreprise est justifiée par des perspectives de croissance plus solides ou par des avantages concurrentiels.
- Comparaison avec les niveaux historiques : comparez le P/E (sur 12 mois) actuel de l'entreprise avec sa propre moyenne historique (sur les 5 ou 10 dernières années, par exemple) afin d'évaluer si la valorisation actuelle se situe à un niveau historiquement haut ou bas.
- Comparaison avec le marché global : comparez le P/E (sur 12 mois) de l'entreprise avec les principaux indices boursiers (tels que le S&P 500) afin d'évaluer sa valorisation par rapport à la tendance générale.
Les ratios P/E peuvent varier considérablement d'un secteur à l'autre, et il n'existe pas de niveau P/E "idéal" unique. Une fourchette de P/E raisonnable dépend du secteur d'activité, du potentiel de croissance de l'entreprise et de l'environnement macroéconomique global. Les décisions d'investissement ne doivent pas reposer uniquement sur le ratio P/E (sur 12 mois) mais doivent s'appuyer sur une analyse complète incluant la qualité de l'entreprise, ses perspectives de croissance et sa santé financière.
Puis-je trader des actions sur Bitget ?
Vous pouvez trader des actions sur Bitget, mais principalement par le biais de tokens d'actions et de Perps sur actions, plutôt que par l'achat ou la vente directe d'actions traditionnelles.
Cette approche reflète la vision de Bitget en tant que plateforme d'échange universelle (UEX), conçue pour connecter les marchés financiers traditionnels aux marchés des cryptomonnaies
Bitget propose actuellement les formats de trading sur actions suivants :
1. Tokens d'actions (Spot)
Nature : les tokens d'actions sont des tokens numériques indexés sur le prix d'actions traditionnelles spécifiques (telles que TSLAUSDT et NVDAUSDT) et se tradent sur le marché Spot de Bitget.
Caractéristiques : lorsque vous tradez des tokens d'actions, vous achetez et détenez des tokens plutôt que de posséder les actions traditionnelles sous-jacentes.
- Le prix de ces tokens suit généralement les fluctuations du prix des actions auxquelles ils sont liés, telles que Tesla ou Nvidia.
- L'avantage est que vous pouvez profiter des mouvements de prix des actifs financiers traditionnels, tels que les actions américaines, en utilisant des cryptomonnaies (par exemple l'USDT), sans avoir besoin d'un compte de courtage traditionnel.
2. Perps sur actions
Nature : Bitget propose également des Futures perpétuels à marge USDT, communément appelés Perps sur actions, basés sur les principales actions américaines telles que Tesla et Meta.
Caractéristiques : les Perps sur actions sont des produits dérivés qui vous permettent de prendre une position haussière ou baissière sur le prix futur d'une action sous-jacente par le biais du trading sur marge. Ces produits permettent généralement un effet de levier pouvant atteindre 25x.
Il n'y a aucune détention de l'actif sous-jacent. Les profits et pertes sont réglés sur la base des mouvements de prix des Futures.
Remarque importante : lorsque vous tradez des Perps sur actions sur Bitget, vous participez aux marchés dérivés au sein de l'écosystème des cryptomonnaies. Cela est fondamentalement différent de l'achat d'actions cotées en bourse via un courtier traditionnel, car vous ne détenez aucune part du capital de la société sous-jacente.
Le trading de Futures et l'utilisation de l'effet de levier comportent des risques élevés. Veuillez vous assurer de bien comprendre les risques avant de trader.
Si vous souhaitez détenir directement des actions traditionnelles et bénéficier des droits d'actionnaire (tels que la perception de dividendes), vous devez passer par une société de courtage en valeurs mobilières ou une plateforme de courtage traditionnelle réglementée.
Quels sont les avantages des Perps sur actions Bitget ?
Les Perps sur actions Bitget, généralement des Futures perpétuels basés sur les prix des tokens d'actions, constituent un service innovant qui permet aux plateformes crypto d'offrir une exposition aux marchés financiers traditionnels.
Par rapport au trading d'actions ou de Futures traditionnel, ils offrent plusieurs avantages uniques, principalement dus à l'infrastructure de trading de la plateforme.
Les Perps sur actions Bitget, généralement des produits dérivés libellés en USDT, offrent les avantages clés suivants :
1. Commodité du trading et accessibilité mondiale
- Trading 24/7 : les marchés boursiers traditionnels, tels que les marchés américains, fonctionnent selon des horaires de trading fixes. En revanche, les marchés des dérivés crypto sont généralement ouverts 24h/24, 7j/7. Cela signifie que les investisseurs tradent à tout moment, profitant ainsi des dernières actualités ou des fluctuations du marché.
- Accès simplifié et démarrage rapide : comparé aux plateformes de courtage classiques dont les procédures de vérification de l'identité et de configuration de compte sont souvent longues, Bitget permet de commencer à trader bien plus rapidement. Les utilisateurs peuvent trader directement avec des cryptomonnaies comme l'USDT, évitant ainsi les formalités complexes liées aux dépôts et retraits de devises fiat.
- Accessibilité mondiale : les utilisateurs accèdent au trading de dérivés liés à des actions mondialement reconnues via la plateforme Bitget, sous réserve des réglementations applicables.
2. Efficacité du capital et effet de levier élevé
- Options à effet de levier élevé : les Perps sur actions offrent généralement un effet de levier plus élevé que le trading d'actions traditionnel (par exemple, jusqu'à 25x). Les traders peuvent ainsi contrôler des positions plus importantes avec des exigences de marge moins élevées, améliorant ainsi l'efficacité du capital.
Remarque : bien qu'un effet de levier élevé puisse amplifier les gains, il amplifie également les pertes de manière proportionnelle. - Trading bidirectionnel : les traders peuvent facilement prendre des positions long et short. Cela signifie que les traders peuvent potentiellement tirer profit de la volatilité du marché, que les prix des actions montent ou baissent, à condition d'anticiper correctement la direction du marché.
3. Trading et règlement en cryptomonnaie
- Marge USDT : les Perps sur actions de Bitget utilisent généralement l'USDT (ou d'autres stablecoins) comme devise de marge et de règlement. Pour les utilisateurs qui détiennent déjà des cryptomonnaies, il n'est pas nécessaire de convertir leurs actifs en devise fiat, ce qui leur permet de trader directement avec des stablecoins.
- Transferts de fonds efficaces : les transferts et règlements basés sur la crypto sont généralement plus rapides que les systèmes fiat traditionnels, permettant une allocation globale des fonds plus efficace.
4. Intégration
Plateforme tout-en-un : Bitget permet aux utilisateurs de trader des cryptomonnaies Spot, des dérivés crypto et des Perps sur actions au sein d'une seule et même plateforme, facilitant ainsi la gestion de différents types d'actifs sur une interface unique.
Bien que les Perps sur actions Bitget offrent plusieurs avantages, il est important de comprendre les risques associés.
- Risque lié à l'effet de levier élevé : trader avec un effet de levier peut entraîner la perte rapide de l'intégralité de votre marge.
- Pas de détention d'actions : les Perps sur actions ne sont pas des actions réelles. Vous ne percevez donc pas de dividendes et ne disposez d'aucun droit de vote.
- Risque de liquidité du marché : les Perps sur tokens d'actions peuvent présenter une liquidité plus faible que leurs équivalents sur les marchés boursiers traditionnels, en particulier en dehors des horaires de trading habituels.
En résumé, les Perps sur actions Bitget offrent des avantages tels qu'une plus grande flexibilité de trading, des barrières à l'entrée plus faibles et une meilleure efficacité du capital.
Quels sont les frais de trading des Perps sur actions Bitget ?
Les frais de trading des Perps sur actions Bitget (Futures perpétuels à marge USDT) comprennent principalement les frais de transaction et les taux de financement.
Frais de transaction :
Bitget organise régulièrement des événements à durée limitée sur les frais des Perps sur actions (en particulier les Perps sur tokens d'actions) afin d'attirer les traders.
Taux de frais standard : selon la structure des frais Futures standard de Bitget, les frais de taker sont généralement d'environ 0,06%, tandis que les frais de maker avoisinent 0,02%.
Événements en cours des Perps sur actions (important) : afin de promouvoir ses produits Perps sur actions, Bitget propose des frais de transaction réduits au quatrième trimestre 2025 (aussi bas que 0,006% pour les takers et 0,002% pour les makers). Profitez également d'un événement à durée limitée avec zéro frais de trading sur les tokens d'actions Spot.
Taux de financement :
Le taux de financement est un mécanisme clé des Futures perpétuels (y compris les Perps sur actions) qui permet de maintenir le prix des Futures étroitement aligné sur le prix Spot de l'actif sous-jacent. Il ne s'agit pas de frais prélevés par la plateforme, mais d'un paiement périodique échangé entre les traders long et short.
Les taux de financement fluctuent de manière dynamique et sont principalement influencés par le sentiment du marché et les déséquilibres entre les positions long et short. Les Perps sur actions connaissent généralement une volatilité moindre que les cryptomonnaies, de sorte que les taux de financement sont souvent relativement bas lorsque les conditions du marché sont stables. Cependant, lors de la saison des résultats ou en cas d'actualités majeures, une forte concentration de positions long ou short – comme sur des actions technologiques à forte croissance telles que Tesla ou Nvidia – peut créer des déséquilibres importants et provoquer une envolée des taux de financement à court terme.
Le paiement des frais de financement est généralement réglé toutes les 8 heures. Si vous fermez votre position avant le règlement des frais de financement, aucun paiement ne sera prélevé ou reçu.
Les taux de financement ne sont pas fixes. Si vous maintenez une position sur une période prolongée, des taux de financement élevés, qu'ils soient positifs (pour les positions long) ou négatifs (pour les positions short), affecteront vos coûts de détention globaux ou vos rendements potentiels. Pour cette raison, il est important de surveiller le taux de financement en temps réel sur l'interface de trading.
Pourquoi Bitget est-elle la plateforme idéale pour trader les Perps sur actions ?
Bitget s'est imposée comme une plateforme d'échange universelle (UEX) de premier plan en comblant le fossé entre la finance traditionnelle (TradFi) et l'écosystème crypto. Fin 2025 et au cours de l'année 2026, elle est devenue l'une des premières grandes plateformes centralisées à proposer des Perps sur actions tokenisés, permettant aux utilisateurs de trader des dérivés d'actions via des outils natifs de la crypto.
Voici pourquoi Bitget est considérée comme une plateforme idéale pour trader les Perps sur actions :
1. Collatéral unifié (marge en USDT)
L'un des plus grands avantages est la possibilité de trader des actions américaines – comme Tesla (TSLA), NVIDIA (NVDA) et Apple (AAPL) – en utilisant l'USDT comme collatéral.
- Aucune conversion fiat : vous n'avez pas besoin de quitter l'écosystème crypto ni de convertir vos fonds en USD pour trader des actions mondiales.
- Efficacité multi-actifs : vous pouvez gérer vos positions crypto et actions depuis un unique compte Futures USDT-M, facilitant ainsi l'allocation de votre capital.
2. Haute efficacité du capital
Bitget propose des options d'effet de levier importantes, généralement indisponibles sur les plateformes de courtage traditionnelles :
- Effet de levier jusqu'à 25x : alors que les courtiers en actions traditionnels limitent souvent les particuliers à un levier de 2x ou 4x, Bitget permet d'atteindre une efficacité du capital nettement supérieure.
- Trading fractionné : vous pouvez trader des actions onéreuses (comme Meta ou Amazon) sans avoir à financer une action complète, grâce à la flexibilité des Futures perpétuels.
Horaires de trading étendus (24h/5j)
Les marchés boursiers traditionnels sont limités par les horaires d'ouverture et les fermetures du week-end. Les produits de Perps sur actions de Bitget sont conçus pour le trader international moderne :
- Accès continu : le trading est généralement disponible 24h/5j (du lundi au vendredi UTC+8), reflétant ainsi la flexibilité des marchés crypto.
- Réactivité macroéconomique : si une grande entreprise technologique publie ses résultats après la clôture de New York, les utilisateurs de Bitget peuvent souvent réagir immédiatement aux mouvements de prix via les marchés de tokens d'actions.
4. Structure de frais compétitive
Bitget a bousculé le modèle de courtage traditionnel grâce à une approche à bas coûts :
- Frais réduits : les frais de transaction pour les Perps sur actions sont souvent égaux ou inférieurs à 0,06%, ce qui est très compétitif par rapport aux courtiers traditionnels et aux autres plateformes hybrides crypto–TradFi.
- Aucune commission cachée : contrairement à de nombreux courtiers "sans frais" qui tirent profit de spreads larges (paiement pour le flux d'ordres), Bitget utilise un modèle transparent de financement et de marge.
5. Trading avancé et copy trading
Bitget apporte son ADN de trading social au marché boursier :
- Copy trading sur actions : vous pouvez suivre des traders experts spécialisés dans les marchés actions et répliquer automatiquement leurs trades de Perps sur actions.
- Outils basés sur l'IA : la plateforme intègre des agents IA qui assistent l'exécution des trades, la gestion des risques et l'analyse technique.
Comment la plateforme Bitget protège-t-elle mieux les actifs des utilisateurs ?
Bitget a mis en place un système de défense multidimensionnel et transparent pour protéger les actifs des utilisateurs, spécifiquement conçu pour répondre aux enjeux de confiance inhérents aux plateformes d'échange centralisées (CEX).
Voici les cinq piliers de la protection des actifs chez Bitget :
Bitget maintient un Fonds de protection dédié, qui constitue l'ultime rempart contre les piratages ou les failles de sécurité.
- Envergure massive : début 2026, la valorisation moyenne du fonds se maintient aux alentours de 600 millions de dollars (avec un pic historique à plus de 750 millions de dollars).
- Diversification des actifs : le fonds est composé d'actifs très liquides tels que le BTC et l'USDT, garantissant la solvabilité même en période de volatilité extrême du marché.
- Auto-financé : ce fonds ne dépend d'aucune assurance tierce. Bitget finance intégralement ce fonds et s'engage à maintenir un solde supérieur à 300 millions de dollars sur au moins trois ans, sans aucun retrait.
Afin de démontrer que la plateforme ne détourne pas les fonds des utilisateurs, Bitget utilise l'architecture de l'arbre de Merkle pour publier régulièrement des rapports de réserves.
- Taux de couverture élevé : les données de janvier 2026 indiquent que le ratio de réserves moyen pour les principaux actifs (BTC, ETH, USDT, USDC) a atteint 163%, dépassant largement le ratio de référence de 1:1.
- Vérification indépendante : les utilisateurs peuvent utiliser des outils open source fournis par la plateforme pour vérifier, via des identifiants anonymes, que leurs actifs sont inclus dans les snapshots de réserves.
3. Isolation des cold/hot wallets et multi-sig
Sur le plan technique, Bitget utilise une architecture de sécurité de niveau bancaire :
- Stockage hors ligne à 95% : la grande majorité des actifs des utilisateurs est conservée dans des cold wallets, totalement isolés d'Internet pour prévenir tout piratage à distance.
- Multi-signatures (multi-sig) : les transferts de fonds critiques nécessitent les signatures de plusieurs détenteurs de clés indépendants et géographiquement dispersés, éliminant ainsi le risque de point de défaillance unique.
4. Politiques rigoureuses de sécurité des retraits
Afin de limiter les risques de vol de comptes individuels, Bitget a mis en place plusieurs mécanismes de protection :
- Blocage de la liste blanche de retrait : après l'ajout d'une nouvelle adresse de retrait, le compte entre dans une période de gel des retraits de 24 heures.
- Confirmation par scan multi-appareils : une fonctionnalité lancée en 2026 exige que tout retrait initié sur le site web soit confirmé en scannant un QR code via l'application mobile, empêchant ainsi efficacement tout cheval de Troie sur PC de falsifier les adresses.
5. Conformité et certification internationale
Bitget s'engage activement en faveur de la réglementation et a obtenu plusieurs certifications internationales en matière de sécurité de l'information :
- ISO 27001 et ISO 27701 : Bitget a obtenu la double certification pour la Gestion de la sécurité de l'information et la Gestion des informations relatives à la vie privée, démontrant ainsi que ses processus internes répondent aux normes de conformité mondiales les plus exigeantes.